
Page 241 - Haematologica Vol. 107 - September 2022
P. 241
LETTER TO THE EDITOR
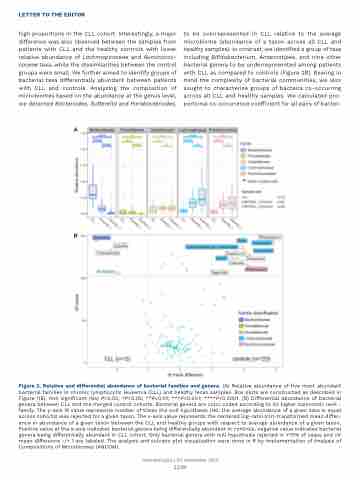
high proportions in the CLL cohort. Interestingly, a major difference was also observed between the samples from patients with CLL and the healthy controls with lower relative abundance of Lachnospiraceae and Ruminococ- caceae taxa, while the dissimilarities between the control groups were small. We further aimed to identify groups of bacterial taxa differentially abundant between patients with CLL and controls. Analyzing the composition of microbiomes based on the abundance at the genus level, we detected Bacteroides, Sutterella and Parabacteroides,
to be overrepresented in CLL relative to the average microbiome (abundance of a taxon across all CLL and healthy samples). In contrast, we identified a group of taxa including Bifidobacterium, Anaerostipes, and nine other bacterial genera to be underrepresented among patients with CLL as compared to controls (Figure 2B). Bearing in mind the complexity of bacterial communities, we also sought to characterize groups of bacteria co-occurring across all CLL and healthy samples. We calculated pro- portional co-occurrence coefficient for all pairs of bacter-
A
B
Figure 2. Relative and differential abundance of bacterial families and genera. (A) Relative abundance of five most abundant bacterial families in chronic lymphocytic leukemia (CLL) and healthy feces samples. Box plots are constructed as described in Figure 1(B). Not significant (Ns) P>0.05; *P<0.05; **P<0.01; ***P<0.001; ****P<0.0001. (B) Differential abundance of bacterial genera between CLL and the merged control cohorts. Bacterial genera are color coded according to its higher taxonomic rank - family. The y-axis W value represents number of times the null hypothesis (H0: the average abundance of a given taxa is equal across cohorts) was rejected for a given taxon. The x-axis value represents the centered log-ratio (clr)-transformed mean differ- ence in abundance of a given taxon between the CLL and healthy groups with respect to average abundance of a given taxon. Positive value at the x-axis indicates bacterial genera being differentially abundant in controls, negative value indicates bacterial genera being differentially abundant in CLL cohort. Only bacterial genera with null hypothesis rejected in >70% of cases and clr mean difference -/+ 1 are labeled. The analysis and volcano plot visualization were done in R by implementation of Analysis of Compositions of Microbiomes (ANCOM).
Haematologica | 107 September 2022
2240
