
Page 240 - Haematologica Vol. 107 - September 2022
P. 240
LETTER TO THE EDITOR
A
B
C
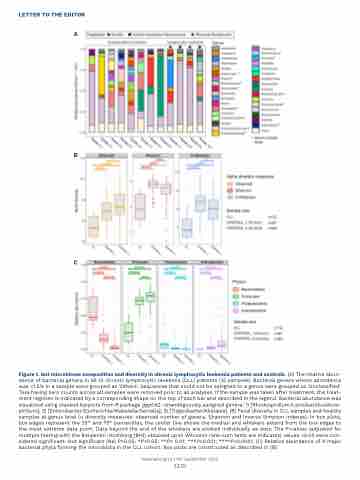
Figure 1. Gut microbiome composition and diversity in chronic lymphocytic leukemia patients and controls. (A) The relative abun- dance of bacterial genera in all 10 chronic lymphocytic leukemia (CLL) patients (12 samples). Bacterial genera whose abundance was <1.5% in a sample were grouped as 'Others'. Sequences that could not be assigned to a genus were grouped as 'Unclassified'. Taxa having zero counts across all samples were removed prior to all analyses. If the sample was taken after treatment, the treat- ment regimen is indicated by a corresponding shape on the top of each bar and described in the legend. Bacterial abundance was visualized using stacked barplots from R package ggplot2. Unambiguously assigned genera: 1) [Rhodospirillum/Lactobacillus/Azos- pirillum]; 2) [Enterobacter/Escherichia/Klebsiella/Serratia]; 3) [Tidjanibacter/Alistipes]. (B) Fecal diversity in CLL samples and healthy samples at genus level (a diversity measures: observed number of genera, Shannon and Inverse Simpson indexes). In box plots, box edges represent the 25th and 75th percentiles, the center line shows the median and whiskers extend from the box edges to the most extreme data point. Data beyond the end of the whiskers are plotted individually as dots. The P-values (adjusted for multiple testing with the Benjamini-Hochberg [BH]) obtained upon Wilcoxon rank-sum tests are indicated, values <0.05 were con- sidered significant. Not significant (Ns) P>0.05; *P<0.05; **P< 0.01; ***P<0.001; ****P<0.0001. (C) Relative abundance of 4 major bacterial phyla forming the microbiota in the CLL cohort. Box plots are constructed as described in (B).
Haematologica | 107 September 2022
2239
