
Page 101 - Haematologica Vol. 107 - September 2022
P. 101
ARTICLE - Body composition impacts CRS after CAR-T therapy D.M. Cordas dos Santos et al.
AB
C
D
E
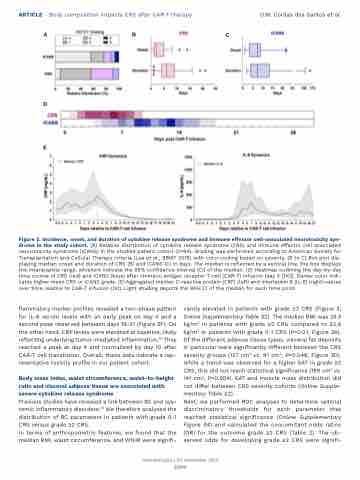
Figure 2. Incidence, onset, and duration of cytokine release syndrome and immune effector cell-associated neurotoxicity syn- drome in the study cohort. (A) Relative distribution of cytokine release syndrome (CRS) and immune effector cell associated neurotoxicity syndrome (ICANS) in the studied patient cohort (n=64). Grading was performed according to American Society for Transplantation and Cellular Therapy criteria (Lee et al., BBMT 2019) with color-coding based on severity. (B to C) Box plot dis- playing median onset and duration of CRS (B) and ICANS (C) in days. The median is reflected by a vertical line, the box displays the interquartile range, whiskers indicate the 95% confidence interval (CI) of the median. (D) Heatmap outlining the day-by-day time course of CRS (red) and ICANS (blue) after chimeric antigen receptor T-cell (CAR-T) infusion (day 0 [D0]). Darker color indi- cates higher mean CRS or ICANS grade. (E) Aggregated median C-reactive protein (CRP) (left) and interleukin 6 (IL-6) (right) values over time relative to CAR-T infusion (D0). Light shading depicts the 95% CI of the median for each time point.
flammatory marker profiles revealed a two-phase pattern for IL-6 serum levels with an early peak on day 4 and a second peak observed between days 19-21 (Figure 2F). On the other hand, CRP levels were elevated at baseline, likely reflecting underlying tumor-mediated inflammation.39 They reached a peak at day 4 and normalized by day 10 after CAR-T cell transfusion. Overall, these data indicate a rep- resentative toxicity profile in our patient cohort.
Body mass index, waist circumference, waist-to-height ratio and visceral adipose tissue are associated with severe cytokine release syndrome
Previous studies have revealed a link between BC and sys- temic inflammatory disorders.22 We therefore analyzed the distribution of BC parameters in patients with grade 0-1 CRS versus grade ≥2 CRS.
In terms of anthropometric features, we found that the median BMI, waist circumference, and WtHR were signifi-
cantly elevated in patients with grade ≥2 CRS (Figure 3; Online Supplementary Table S2). The median BMI was 24.3 kg/m2 in patients with grade ≥2 CRS compared to 22.9 kg/m2 in patients with grade 0-1 CRS (P=0.01, Figure 3A). Of the different adipose tissue types, visceral fat deposits in particular were significantly different between the CRS severity groups (127 cm2 vs. 91 cm2, P=0.048, Figure 3D). While a trend was observed for a higher SAT in grade ≥2 CRS, this did not reach statistical significance (169 cm2 vs. 141 cm2, P=0.054). EAT and muscle mass distribution did not differ between CRS severity cohorts (Online Supple- mentary Table S2).
Next, we performed ROC analyses to determine optimal discriminatory thresholds for each parameter that reached statistical significance (Online Supplementary Figure S4) and calculated the concomitant odds ratios (OR) for the outcome grade ≥2 CRS (Table 2). The ob- served odds for developing grade ≥2 CRS were signifi-
Haematologica | 107 September 2022
2100
