
Page 99 - Haematologica Vol. 107 - September 2022
P. 99
ARTICLE - Body composition impacts CRS after CAR-T therapy D.M. Cordas dos Santos et al.
single CT slices at lumbar spine 3 (L3) were performed. Muscle indices (PMI, SMI) were calculated by dividing mean muscle area by height. EAT content was quantified by calculating the mean EAT amount at the bottom, middle (4-chamber view) and top (left main coronary ar- tery view) of the heart. Adipose and muscle tissue dis- crimination was based on predefined Hounsfield units (HU) ranges (-190 to -30 HU for SAT, -150 to -50 HU for VAT, -190 to -30 HU for EAT, -29 to +150 HU for PM/SM).36-38 Cross-sectional areas of respective tissues were com- puted for each image. Segmentation analyses were per- formed with ImageJ and the Slice-O-Matic software package (v5.0, Tomovision, Magog, Quebec, Canada). Waist was measured with ImageJ software (v2.0).
Analysis of cytokine dynamics
Baseline cytokine levels were determined prior to LDC (e.g., day -5). Peak CRP (mg/dL), IL-6 (pg/mL), and ferritin (μg/L) levels were measured daily from CAR-T transfusion until discharge and on subsequent outpatient visits. The total study time frame was day 0-21. Laboratory measure- ments were performed according to clinical standard procedures in the clinical laboratory of the University Hos- pital of the LMU Munich. The temporal analysis of IL-6 (pg/mL) over time was performed by computing the ag- gregated median value for each day between days 0-21. In order to distinguish differences between curves, mixed- effects analysis considering both time and effect size using the restricted maximum likelihood method was per- formed (GraphPad Prism v9.0).
Statistical analysis
Patient characteristics, BC and serum parameters ana- lyses were compared using the Mann Whitney test or Stu- dent’s t-test according to data distribution for continuous variables, and the Fisher’s exact test and chi-squared test for categorical variables. Continuous variables were re- ported as median and IQR if not stated otherwise. The area under the curve (AUC) and the 95% confidence in- terval (95% CI) of the receiver operating characteristic (ROC) analysis was computed using the predicted proba- bility for the development of CRS grade ≥2. Optimal dis- criminatory thresholds were determined by optimizing the respective Youden J statistic. Multivariate adjusted analy- sis was performed as binary logistic regression for the outcome of grade ≥2 CRS. The model included baseline clinical characteristics (e.g., age, costimulatory domain), laboratory parameters (e.g., albumin, platelet count), markers of inflammation (e.g., CRP, ferritin, IL-6), and markers of tumor burden (e.g., LDH, STLV) as candidate predictors. The individual BC parameters (BMI, Waist, WtHR, and VAT) were introduced to the model separately to account for multicollinearity (Online Supplentary Table S6). In order to measure the relationship between two
continuous variables, Spearman correlation analyses were used. Significance was defined as P<0.05. Statistical analysis was performed using GraphPad Prism v9.0 (GraphPad Software, Inc.) and SPSS v26.0.
Results
Description of the cohort and the real-world toxicity profile
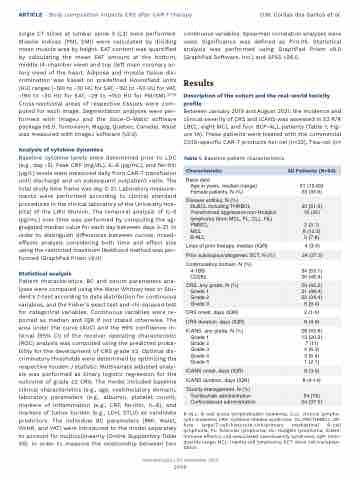
Between January 2019 and August 2021, the incidence and clinical severity of CRS and ICANS was assessed in 52 R/R LBCL, eight MCL and four BCP-ALL patients (Table 1; Fig- ure 1A). These patients were treated with the commercial CD19-specific CAR-T products Axi-cel (n=22), Tisa-cel (n=
Table 1. Baseline patient characteristics.
Characteristic
All Patients (N=64)
Basic data
Age in years, median (range) Female patients, N (%)
61 (19-82) 23 (35.9)
Disease entities, N (%)
DLBCL including THRBCL Transformed aggressive non-Hodgkin lymphoma (from MCL, FL, CLL, HL) PMBCL
MCL
B-ALL
33 (51.6) 16 (25)
2 (3.1) 8 (12.5) 5 (7.8)
Lines of prior therapy, median (IQR)
4 (3-5)
Prior autologous/allogeneic SCT, N (%)
24 (37.5)
Costimulatory domain, N (%) 4-1BB
CD28z
34 (53.1) 30 (46.9)
CRS, any grade, N (%) Grade 1
Grade 2 Grade 3
59 (92.2) 31 (48.4) 22 (34.4) 6 (9.4)
CRS onset, days (IQR)
2 (1-5)
CRS duration, days (IQR)
6 (4-9)
ICANS. any grade, N (%) Grade 1
Grade 2 Grade 3 Grade 4 Grade 5
28 (43.8) 13 (20.3) 7 (11) 4 (6.3) 3 (6.4) 1 (2.1)
ICANS onset, days (IQR)
8 (3-9)
ICANS duration, days (IQR)
8 (4-14)
Toxicity management, N (%) Tocilizumab administration Corticosteroid administration
54 (79) 24 (37.5)
Haematologica | 107 September 2022
2098
B-ALL: B-cell acute lymphoblastic leukemia; CLL: chronic lympho- cytic leukemia; CRS: cytokine release syndrome; DL/PM/THRBCL: dif- fuse large/T-cell/histocyte-rich/primary mediastinal B-cell lymphoma; FL: follicular lymphoma; HL: Hodgkin lymphoma; ICANS: immune effector cell-associated neurotoxicity syndrome; IQR: inter- quartile range; MCL: mantle cell lymphoma; SCT: stem cell transplan- tation.
