
Page 100 - Haematologica Vol. 107 - September 2022
P. 100
ARTICLE - Body composition impacts CRS after CAR-T therapy D.M. Cordas dos Santos et al.
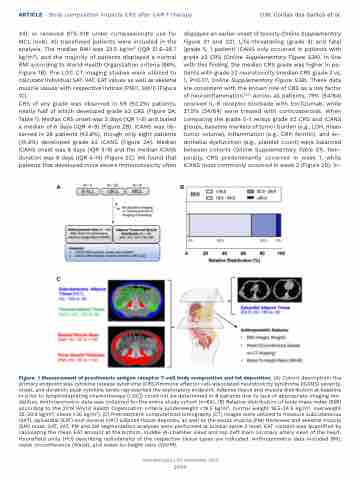
34), or received KTE-X19 under compassionate use for MCL (n=8). All transfused patients were included in the analysis. The median BMI was 23.5 kg/m2 (IQR 21.6-26.7 kg/m2), and the majority of patients displayed a normal BMI according to World Health Organization criteria (66%, Figure 1B). Pre-LDC CT imaging studies were utilized to calculate individual SAT, VAT, EAT values as well as skeletal muscle values with respective indices (PM/I, SM/I) (Figure 1C).
CRS of any grade was observed in 59 (92.2%) patients, nearly half of which developed grade ≥2 CRS (Figure 2A; Table 1). Median CRS onset was 2 days (IQR 1-5) and lasted a median of 6 days (IQR 4-9) (Figure 2B). ICANS was ob- served in 28 patients (43.8%), though only eight patients (14.8%) developed grade ≥2 ICANS (Figure 2A). Median ICANS onset was 8 days (IQR 3-9) and the median ICANS duration was 8 days (IQR 4-14) (Figure 2C). We found that patients that developed more severe immunotoxicity often
displayed an earlier onset of toxicity (Online Supplementary Figure S1 and S2). Life-threatening (grade 4) and fatal (grade 5, 1 patient) ICANS only occurred in patients with grade ≥2 CRS (Online Supplementary Figure S3A). In line with this finding, the median CRS grade was higher in pa- tients with grade ≥2 neurotoxicity (median CRS grade 2 vs. 1, P=0.07, Online Supplementary Figure S3B). These data are consistent with the known role of CRS as a risk factor of neuroinflammation.16,17 Across all patients, 79% (54/64) received IL-6 receptor blockade with tocilizumab, while 37.5% (24/64) were treated with corticosteroids. When comparing the grade 0-1 versus grade ≥2 CRS and ICANS groups, baseline markers of tumor burden (e.g., LDH, mean tumor volume), inflammation (e.g., CRP, ferritin), and en- dothelial dysfunction (e.g., platelet count) were balanced between cohorts (Online Supplementary Table S1). Tem- porally, CRS predominantly occurred in week 1, while ICANS most commonly occurred in week 2 (Figure 2D). In-
AB
C
Figure. 1 Measurement of prechimeric antigen receptor T-cell body composition and fat deposition. (A) Cohort description; the primary endpoint was cytokine release syndrome (CRS)/immune effector cell-associated neurotoxicity syndrome (ICANS) severity, onset, and duration; peak cytokine levels represented the exploratory endpoint. Adipose tissue and muscle distribution at baseline (= prior to lymphodepleting chemotherapy [LDC]) could not be determined in 8 patients due to lack of appropriate imaging mo- dalities. Anthropometric data was collected for the entire study cohort (n=64). (B) Relative distribution of body mass index (BMI) according to the 2019 World Health Organization criteria (underweight <18.5 kg/m2, normal weight 18.5-24.9 kg/m2, overweight 25-29.9 kg/m2, obese >30 kg/m2). (C) Pretreatment computerized tomography (CT) images were utilized to measure subcutaneous (SAT), epicardial (EAT) and visceral (VAT) adipose tissue deposits, as well as the psoas muscle (PM) thickness and skeletal muscle (SM) mass. SAT, VAT, PM and SM segmentation analyses were performed at lumbar spine 3 level. EAT content was quantified by calculating the mean EAT amount at the bottom, middle (4-chamber view) and top (left main coronary artery view) of the heart. Hounsfield units (HU) describing radiodensity of the respective tissue types are indicated. Anthropometric data included BMI, waist circumference (Waist), and waist-to-height ratio (WtHR).
Haematologica | 107 September 2022
2099
