
Page 102 - Haematologica Vol. 107 - September 2022
P. 102
ARTICLE - Body composition impacts CRS after CAR-T therapy D.M. Cordas dos Santos et al.
cantly higher for patients with a BMI ≥27.05 kg/m2 (P=0.007), waist ≥99.23 cm (P=0.04), WtHR ≥0.594 cm/m2 (P=0.01) and VAT ≥144.3 cm2 (P=0.02). The AUC of the ROC curve ranged between 0.63 to 0.67. Importantly, previously identified CRS risk factors such as age, tumor burden and certain laboratory parameters7-11 were distributed equally between patient cohorts based on the defined thresholds for BMI, waist, WtHR and VAT (Online Supplementary Table S3). On multivariate adjusted analysis, we confirmed that these four BC parameters represent independent risk fac- tors of grade ≥2 CRS (Table 3). With adjusted odds ratios ranging from 1.15 to 1.37, they signficantly increased the
probability of grade ≥2 CRS. Collectively, these findings suggest a contributing role of visceral adipose tissue for CRS severity.
Body mass index, waist, waist-to-height ratio and visceral adipose tissue correlate with cytokine release syndrome dynamics
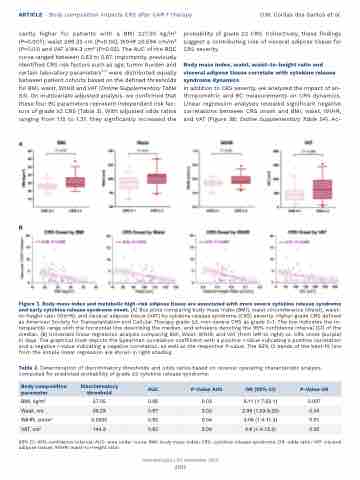
In addition to CRS severity, we analyzed the impact of an- thropometric and BC measurements on CRS dynamics. Linear regression analyses revealed significant negative correlations between CRS onset and BMI, waist, WtHR, and VAT (Figure 3B; Online Supplementary Table S4). Ac-
A
B
Figure 3. Body mass index and metabolic high-risk adipose tissue are associated with more severe cytokine release syndrome and early cytokine release syndrome onset. (A) Box plots comparing body mass index (BMI), waist circumference (Waist), waist- to-height ratio (WtHR), and visceral adipose tissue (VAT) by cytokine release syndrome (CRS) severity. Higher-grade CRS defined as American Society for Transplantation and Cellular Therapy grade ≥2, non-severe CRS as grade 0-1. The box indicates the in- terquartile range with the horizontal line describing the median, and whiskers denoting the 95% confidence interval [CI] of the median. (B) Univariate linear regression analysis comparing BMI, Waist, WtHR, and VAT (from left to right) vs. CRS onset (purple) in days. The graphical inset depicts the Spearman correlation coefficient with a positive r-value indicating a positive correlation and a negative r-value indicating a negative correlation, as well as the respective P-value. The 95% CI bands of the best-fit line from the simple linear regression are shown in light shading.
Table 2. Determination of discriminatory thresholds and odds ratios based on receiver operating characteristic analysis computed for predicted probability of grade ≥2 cytokine release syndrome.
95% CI: 95% confidence interval; AUC: area under curve; BMI: body mass index; CRS: cytokine release syndrome; OR: odds ratio; VAT: visceral adipose tissue; WtHR: waist-to-height ratio
Haematologica | 107 September 2022
Body composition parameter
Discriminatory threshold
AUC
P-Value AUC
OR (95% CI)
P-Value OR
BMI, kg/m2
27.05
0.66
0.03
6.11 (1.7-22.1)
0.007
Waist, cm
99.23
0.67
0.02
2.96 (1.03-8.29)
0.04
WtHR, cm/m2
0.5935
0.65
0.04
4.06 (1.4-11.3)
0.01
VAT, cm2
144.3
0.63
0.09
4.8 (1.4-15.2)
0.02
2101
