
Page 44 - 2022_03-Haematologica-web
P. 44
S. Ramos-Campoy et al.
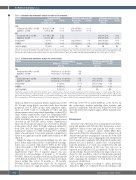
Table 4. Univariate and multivariate analysis for time to first treatment.
Variable
CBA
low/intermediate-CK vs. non-CK high-CK vs. non-CK
GM
intermediate-GC vs. low-GC high-GC vs. low-GC
Del/mut TP53
U-IGHV
del(11)(q22q23)
Univariate analysis
Multivariate analysis for CBA
Multivariate analysis for GM
Median TTFT
in months (95% CI)
18 (11-25) vs. NR 5 (1-9) vs. NR
35 (0-74) vs. NR 3 (0-6) vs. NR
4 (0-9)
12 (4-20)
17 (9-25)
P-value
<0.001 <0.001
0.022 <0.001
<0.001
<0.001
0.111
Hazard ratio (95% CI)
2.54 (1.47-4.41) 3.23 (1.81-5.76)
- -
1.72 (1.14-2.60)
1.71 (1.12-2.61)
NA
P-value
<0.001 <0.001
- -
0.010
0.012
NA
Hazard ratio (95% CI)
- -
1.24 (0.76-2.04) 2.74 (1.61-4.67)
1.44 (0.92-2.26)
2.12 (1.39-3.22)
NA
P-value
- -
0.395 <0.001
0.109
<0.001
NA
CBA: chromosome banding analysis; CK: complex karyotype; non-CK: 0-2 abnormalities detected by CBA; low/intermediate-CK: 3-4 abnormalities; high-CK: ≥5 abnormalities; GM: genomic microarrays; GC: genomic complexity; low-GC: 0-2 copy number abnormalities (CNA) detected by genomic microarrays; intermediate-GC: 3-4 CNA; high-GC: ≥5 CNA; del/mut TP53: abnormalities in TP53 include deletion in 17p13 and/or mutation in TP53 gene; U-IGHV: CLL with unmutated IGHV; NR: not reached; NA: not assessed.
Table 5. Univariate and multivariate analysis for overall survival.
Variable
CBA
low/intermediate-CK vs. non-CK high-CK vs. non-CK
GM
intermediate-GC vs. low-GC high-GC vs. low-GC
Del/mut TP53 U-IGHV del(11)(q22q23)
Univariate analysis Median OS in months
(95% CI)
114 (65-163) vs. 102 (83-121) 68 (25-111) vs. 102 (83-121)
114 (64-164) vs. 103 (55-151) 68 (32-104) vs. 103 (55-151)
50 (29-71) 79 (58-100) 79 (53-105)
Multivariate analysis for GM*
P-value
0.729 0.133
0.741 0.003
<0.001 0.008 0.255
Hazard ratio (95% CI)
- -
0.69 (0.36-1.34) 1.51 (0.76-3.01)
1.89 (1.05-3.42) 1.97 (1.15-3.36) NA
P-value
- -
0.275 0.244
0.034 0.013 NA
*Multivariate analysis for CBA-defined risk categories was not performed due to the lack of statistical significance in the univariate analysis. OS: overall survival; CBA: chromo- some banding analysis; CK: complex karyotype; non-CK: 0-2 abnormalities detected by CBA; low/intermediate-CK: 3-4 abnormalities; high-CK: ≥5 abnormalities; GM: genomic microarrays; GC: genomic complexity; low-GC: 0-2 copy number abnormalities (CNA) detected by genomic microarrays; intermediate-GC: 3-4 CNA; high-GC: ≥5 CNA; del/mut TP53: abnormalities in TP53 include deletion in 17p13 and/or mutation in TP53 gene; U-IGHV: CLL with unmutated IGHV; NR: not reached; NA: not assessed.
with non-CK/low-GC patients (Online Supplementary Table S6). Despite being highly associated with these known prognostic factors, three groups with significant differ- ences on TTFT could be established by CBA and GM when patients were categorized depending on their TP53 status (Online Supplementary Figure S3). Regarding IGHV status, similar results were obtained within the mutated IGHV (M-IGHV) group while no clear discrimination was observed in the U-IGHV subset (Online Supplementary Figure S4). No prognostic impact was observed for del(11q) in the entire cohort (Table 4). High complexity defined by both CBA and GM maintained its significance when a multivariate analysis for TTFT including TP53 and IGHV status was performed. Conversely, genomic complexity by GM lost its significance in the multivariate analysis for OS (Table 5).
Finally, the impact of other genetic findings was also ana- lyzed. In this regard, the presence of unbalanced rearrange- ments was associated with shorter TTFT in the entire cohort (11 months vs. NR; P<0.001) and within the non-CK subgroup (10 months vs. NR; P=0.001) (Online Supplementary Figure S5). A negative impact was also observed for chromothripsis (2 months vs. 37 months; P<0.001), which was mainly found among CK patients (29 of 30). Indeed, tendency to this worse evolution was main- tained within this subset (5 months vs. 15 months; P=0.062) (Online Supplementary Figure S6). As expected, these cases showed a high frequency of abnormalities in
TP53 (22 of 30; 73.3%) and U-IGHV (21 of 29; 72.4%). In the multivariate analysis including these features and genomic complexity, only the latter defined by both CBA and GM retained its negative impact (Online Supplementary Table S7).
Discussion
In recent years, there has been a rising interest in identi- fying CLL patients with CK since they may pursue a more aggressive clinical course and respond less well to treat- ment.2,4,28 Large co-operative studies within ERIC have demonstrated that five abnormalities is the optimal cut-off which better predicts an impaired outcome by both CBA and GM.5,25 However, data comparing the risk stratification based on genomic complexity by both methods in the same patients are scarce. Indeed, a small cohort of 122 patients from the Leeksma et al. study was analyzed by GM and CBA, but the proportion of CK cases was very low, as expected in an unselected CLL population. To the best of our knowledge, the present study is the largest report con- ducted to date in which a cohort of CLL patients enriched in CK cases has been simultaneously analyzed by CBA and GM, comparing the usefulness of both methods in their prognostic stratification.
By clustering patients according to criteria previously defined by ERIC, we confirmed that both techniques did
600
haematologica | 2022; 107(3)
