
Page 42 - 2022_03-Haematologica-web
P. 42
S. Ramos-Campoy et al.
A
B
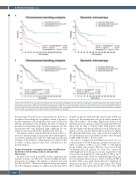
Figure 2. Kaplan-Meier plots for time to first treatment and overall survival based on genomic complexity stratification assessed by chromosome banding analysis and genomic microarrays. Kaplan-Meier estimation for time to first treatment (TTFT) (A) and overall survival (OS) (B) in patients classified in each category based on total number of aberrations found by chromosome banding analysis (CBA): non-complex karyotype (non-CK) (0-2 abnormalities [abn.]), low/intermediate-CK (3-4 abn.) or high-CK (≥5 abn.) (plots on the left) and based on total number of copy number aberrations (CNA) detected by genomic microarrays (GM): low-genomic complexity (GC) (0-2 CNA), intermediate-GC (3-4 CNA) or high-GC (≥5 CNA)] (plots on the right).
the karyotype (73 and 19 cases, respectively). No division of the tumor clone during the cytogenetics culture is the most feasible explanation for 50 patients who carried CNA ≥10 Mb that should have been identified by CBA, of which 17 presented a normal karyotype. Detailed comparison for the ten patients who only displayed high complexity by one method is shown in the Online Supplementary Table S4.
The genetic analysis using both methods allowed the cor- rection of the karyotype in six patients after GM interpreta- tion (Online Supplementary Table S5). Although it resulted in a change of the number of abnormalities recorded by CBA for three of them, initial counts were considered for the present analysis.
Prognostic impact of complex karyotype stratification by chromosome banding analysis and genomic microarrays
As previously stated in the ERIC studies, significant dif- ferences in terms of TTFT were observed within the three risk groups according to the number of aberrations found by CBA and GM.5,25 Whereas the highest risk group defined by both techniques displayed a similar short median TTFT
(5 and 3 months by CBA and GM, respectively), TTFT was shorter for the intermediate risk group when defined by CBA (18 months vs. 35 months) (Figure 2A). Indeed, both methods showed a similar accuracy for predicting TTFT (C- index: 0.67 by CBA vs. 0.65 by GM). With regard to OS, only the highest risk groups defined by each technique dis- played a poorer outcome (68 months in both cases) (Figure 2B) although differences were only statistically significant in GM defined groups. Equivalent C-indexes were obtained for OS (0.55 by CBA vs. 0.57 by GM).
In order to compare the discriminatory power for out- come prediction of both techniques, patients were first clas- sified according to CBA to assess TTFT of GM-defined groups within each category. Of note, those non-CK and low/intermediate-CK patients by CBA who carried ≥5 CNA (high-GC) showed a poor outcome equivalent to that observed in the high-CK by CBA (median TTFT: 2 and 1 months, respectively). However, within the high-CK group, low-GC patients did not show a better evolution (TTFT: 2 months) while cases with intermediate-GC displayed an unexpected median TTFT of 22 months (Figure 3A). When these analyses were performed in the reverse order, CBA
598
haematologica | 2022; 107(3)
