
Page 40 - 2022_03-Haematologica-web
P. 40
S. Ramos-Campoy et al.
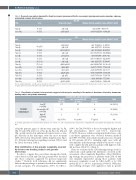
Table 2. Recurrent copy number abnormalities found by genomic microarrays within the non-complex karyotype and complex karyotype subgroups and minimal common altered regions.
CNA
Gain 2p Loss 14q
CNA
Gain 2p Gain 2p
Loss 3p Gain 3q Loss 4p Loss 6q Loss 8p Gain 8q Loss 14q Loss 15q Gain 15q Gain 17q Loss 18p
Gain 19q
n (%)
16 (8.8) 13 (7.1)
n (%)
39 (24.7)
13 (8.2)
11 (6.9)
15 (9.5)
15 (9.5)
16 (10.1)
17 (10.8)
13 (8.2)
16 (10.1)
11 (6.9)
12 (7.6)
24 (15.2)
12 (7.6)
Cytogenetic bands
p25.3-p21 q24.1-q32.11
Cytogenetic bands
p24.3-p23.1 p22.3-p15
p21.31-p21.31
q26.1-q29
p16.2-p15.2
q16.3-q21
p23.1-p22
q24.21-q24-21
q24.2-q24.3
q15.1-q15.1
q22.31-q26.3
q22-q25.1
p11.31-p11.23
q13.41-q13.42
Non-CK
CK
Minimal deleted/amplified region (GRCh37/hg19)
chr2: 29,477 - 45,859,076 chr14: 69,272,718 - 91,882,259
Minimal deleted/amplified region (GRCh37/hg19)
chr2: 15,664,402 - 30,125,169 chr2: 32,877,675 - 62,206,329
chr3: 47,084,224 - 48,321,854
chr3: 165,375,394 - 196,284,424
chr4: 5,481,786 - 25,640,042
chr6: 103,468,966 - 112,256,460
chr8: 12,617,155 - 15,933,687
chr8: 128,286,744 - 130,380,043
chr14: 70,711,555 - 77,202,084
chr15: 41,755,587 - 42,090,500
chr15: 66,265,674 - 99,711,975
chr17: 56,560,919 - 71,135,799
chr18: 4,853,926 - 7,717,988
chr19: 51,943,080 - 54,499,334
In non-complex karyotype (non-CK) group,aberrations were considered recurrent if present in at least ten patients while in CK group,recurrence was set at 10 and 15 patients for gains and losses, respectively. CNA: copy number abnormality.
Table 3. Classification of patients in the previously suggested risk categories according to the number of aberrations detected by chromosome banding analysis and genomic microarrays.
CHROMOSOME BANDING ANALYSIS
GENOMIC MICROARRAYS
Low-GC (0-2 CNA)
Intermediate-GC (3-4 CNA)
High-GC (≥5 CNA)
Non-CK (0-2 abn.)
157 23 2
182 (53.5%)
Low / Intermediate-CK (3-4 abn.)
27
37
17
81 (23.8%)
High-CK (≥5 abn.)
8
23
46
77 (22.6%)
Total
192 (56.5%) 83 (24.4%) 65 (19.1%) 340
A moderate agreement was observed between methods (κ=0.507;P<0.001). CK: complex karyotype; GC: genomic complexity; CNA: copy number abnormality; abn.: abnormal- ities.
along the genome, gains of chromosome arms 2p, 3q, 8q, 15q, 17q and 19q and losses at 3p, 4p, 6q, 8p, 14q, 15q and 18p, usually involved in unbalanced translocations or sim- ple deletions in the karyotype, were the most recurrent CNA detected in CK patients (Online Supplementary Figure S1). Detailed information regarding recurrent CNA found by GM is shown in Table 2.
Risk stratification of the genomic complexity observed by chromosome banding analysis and genomic microarrays
In order to compare the concordance among risk stratifi- cation based on CBA and GM data, patients were classified into those categories suggested by previous large-scale studies.5,25 Notably, both techniques did not significantly differ in the percentage of patients classified into intermedi- ate-risk categories (3-4 abnormalities; 23.8% by CBA vs.
24.4% by GM; P=0.923) or those showing the highest risk (≥5 abnormalities; 22.6% and 19.1%, respectively; P=0.299). However, when focusing in individual cases, only a moderate agreement was observed between methods (κ=0.507; P<0.001). Discordant classification was obtained in 100 patients (29.4%), including eight cases with ≥5 abnormalities in the karyotype which would not be consid- ered complex by GM and two patients with high-GC who did not have CK (2.9%) (Table 3).
Next, we evaluated if the CNA filtering strategy used for GM results could underlie the differences observed in the assessment of the complexity. Regardless of the CNA filter- ing strategy, the proportion of patients with CNA <5 Mb was similarly represented among those patients with increased complexity scored by CBA (n=58) or by GM (n=42) (55.2% vs. 64.3%, respectively; P=0.413). When less strict filtering strategies were applied for GM, no greater
Total
596
haematologica | 2022; 107(3)
