
Page 39 - 2022_03-Haematologica-web
P. 39
Genome complexity in CLL: karyotype versus microarrays
Statistical analyses
Descriptive statistics were used to provide frequency distribu- tions of discrete variables while statistical measures were used to provide median values and ranges for quantitative variables. Groups were compared using Chi-square or Fisher exact tests for discrete variables and Mann-Whitney U test for continuous vari- ables. The Kappa coefficient was used for assessing the agreement in patients categorization among techniques. Survival analysis was restricted to 259 patients. A total of 81 non-CK cases from three institutions were excluded as CBA was performed at recruit- ment for clinical trials, introducing a bias in the results. Time to first treatment (TTFT), the end point of the study, was calculated from the date of cytogenetic study to the date of first treatment or last follow-up while overall survival (OS) was defined from date of cytogenetic study until last follow-up or death. Kaplan–Meier method was used to estimate the distribution of TTFT and OS. Comparisons among patient subgroups were performed with the log-rank test. The concordance statistic (C-index) was calculated to assess the accuracy of CBA and GM for predicting TTFT and OS. Multivariate analysis using Cox proportional hazards regres- sion model was used to assess the maintenance of the independ- ent prognostic impact on TTFT and OS. Statistical analyses were performed using SPSS v.23 software (SPSS Inc, Chicago, IL, USA) and R v3.5.2. P-values <0.05 were considered statistically signifi- cant.
Additional information regarding the methodology of the study is detailed in the Online Supplementary Appendix.
Results
Number and type of abnormalities detected by chromosome banding analysis and genomic microarrays
Regarding CBA, 270 of 340 (79.4%) patients showed an abnormal karyotype. Overall, 182 were considered non-CK (0-2 abn.) while 158 displayed a CK (≥3 abn.). The vast majority of non-CK aberrant cases carried only one aberra- tion (75 of 112; 66.9%), while the median number of abnor- malities among CK patients was four (range, 3-19). Abnormal karyotypes from the non-CK group mainly included known recurrent CLL aberrations, the most fre- quent being trisomy of chromosome 12 (15.4% patients). In contrast, the CK group showed a wide variety of abnormal- ities affecting all chromosomes and included unbalanced structural aberrations (552 of 823; 67.1%), complex abnor- malities affecting material of unknown origin (179 of 823; 21.7%) and monosomies (155 of 823; 18.8%). In seven of these, a co-existence of +12 and +19, associated with more indolent course, was found (4.4%). Balanced translocations, potentially missed when studied by GM, were present in only 57 patients (11.5% non-CK; 22.8% CK). Even though they were detected in a minority of cases, 13q14 and 14q32 loci were recurrently involved (in 13 and seven patients, respectively).
GM had the highest detection rate of abnormalities, with 309 of 340 (90.9%) cases carrying at least one CNA when all the abnormalities, irrespective of their size, were consid- ered. No significant differences were observed among the GM platforms used. Expectedly, the non-CK group showed a significantly lower median number of CNA compared with CK patients (2 CNA; range, 0-10 vs. 6 CNA; range, 0- 51; P<0.001). Nearly half of the patients carried at least one small (<5 Mb) non-classical CLL CNA (median size 5.38 Mb; range, 0.019-198 Mb) that would not be taken into
consideration following the current microarray recommen- dations (35.7% non-CK vs. 64.6% CK patients; P<0.001). Although they were less frequent, similar results were observed regarding the presence of non-classical CLL CNA below 1 Mb (26.9% vs. 44.9%; P<0.001). Patterns sugges- tive of chromothripsis or chromothripsis-like were identi- fied in 30 patients (20 and ten cases, respectively).
Fluorescence in situ hybridization (FISH), the gold stan- dard method for the detection of the four genetic abnormal- ities included in the Döhner et al. prognostic hierarchical model,27 confirmed the higher incidence of high-risk aberra- tions in the CK group. Specifically, del(11q) was found in 12.4% (22 of 177) of non-CK patients and 32.2% (49 of 152) of CK patients (P<0.001) while del(17p) was present in 4.5% (eight of 177) and 40.1% (61 of 152), respectively (P<0.001). Detection of del(13q), del(11q) and del(17p) was lower by CBA compared to FISH although these loci were involved in different type of abnormalities (Online Supplementary Table S2). GM showed a high concordance with FISH results (Online Supplementary Table S3).
With regard to commonly detected non-classical CLL abnormalities, similar results were observed by both CBA and GM among non-CK and CK patients. The only recur- rent aberrations detected by CBA within the non-CK group were deletions in the long arm of chromosome 14 (6.6%) and unbalanced translocations affecting 2p arm (5.5%), which were detected as losses at 14q and gains of 2p region by GM, respectively. Likewise, despite being distributed
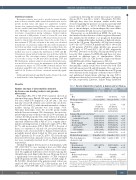
Table 1. Baseline characteristics of patients at diagnosis and last follow-up.
Sex Men
Median age at diagnosis
Stage at diagnosis MBL
CLL Binet A
118 (64.8%) 66 years (29-89)
11 (6.0%) 171 (94.0%) 117/159 (73.6%) 42/159 (26.4%)
103/182 (56.6%) 70/103 (67.9%) 29/182 (15.9%) 25/182 (13.7%) 21/164 (12.8%) 8/182 (4.4%) 15/161 (9.3%)
80/169 (47.3%) 68 months (0-261) 3.5 months (0-242)
32/101 (31.7%) NR
102 months (82-121)
113 (71.5%) 68 years (33-96)
2 (1.3%) 156 (98.7%) 80/136 (58.8%) 56/136 (41.2%)
96/158 (60.8%) 25/96 (26.0%) 27/158 (17.1%) 49/158 (31.0%) 70/156 (44.9%) 65/158 (41.1%) 45/147 (30.6%)
92/138 (66.7%) 29 months (0-160) 0 months (0-298)
103/151 (68.2%) 13 months (8-18)
81 months (58-103)
NON-CK GROUP CK GROUP n=182;n(%) n=158;n(%)
P-value
0.115 0.056
0.024 0.009
0.437 <0.001 0.775 <0.001 <0.001 <0.001 <0.001
<0.001 <0.001 <0.001
<0.001 <0.001
0.367
Binet B/C
Common CLL genomic aberrations*
del(13)(q14)
isolated del(13)(q14)
Trisomy 12 del(11)(q22q23) Aberrations in TP53**
del(17)(p13) TP53 mutation
Unmutated IGHV
Median follow-up (range)
Time from diagnosis to cytogenetic study
Treatment
Treated patients Median time to first treatment (95% CI)
Survival
Median overall survival (95% CI)
*Deletions and trisomy detected by fluorescence in situ hybridization (FISH) and/or genomic microarrays. **Cases in which TP53 mutation screening was not performed and FISH and/or genomic microarrays were negative for deletion were not considered. CLL: chronic lymphocyt- ic leukemia; CK: complex karyotype; MBL: monoclonal B-cell lymphocytosis; CI: confidence interval, NR: not reached.
haematologica | 2022; 107(3)
595
