
Page 171 - 2022_03-Haematologica-web
P. 171
ZBP1 regulates myeloma cell proliferation via IRF3/IRF4
AB
CDE
FG
HI
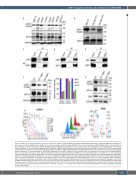
Figure 4. ZBP1 as a scaffold for IRF3 constitutive activation by TBK1. (A) Immunoblotting analysis of pIRF3/IRF3 expression in myeloma (MM.1S and H929) and non-myeloma cell lines (K562; Jurkat; HL60: acute myeloid leukemia; DG75: B lineage; AR230: chronic myeloid leukemia; GM1271: Epstein-Barr virus-transformed B-cell lineage). (B) Immunoblotting for pIRF3/IRF3 expression in MM patient-derived bone marrow plasma cells (PC) purified for CD138+ using CD138 immunomag- netic microbeads. (C, D) Immunoblotting against IRF3 and ZBP1 in MM.1S cells following co-immunoprecipitation with anti-ZBP1 (C), or anti-IRF3 (D) or corresponding isotype control antibodies. (E) Immunoblotting against TBK1 and ZBP1 in MM.1S cells following co-immunoprecipitation with anti-ZBP1 or its corresponding isotype control antibodies. (F) Immunoblotting for pIRF3/IRF3 expression in anti-ZBP1 shRNA1 (sh1) or shRNA2 (sh2) or scrambled (scr) control RNA transduced MM.1S cells on day 4 after transduction (left). ImageJ quantification shows profound reductions in pIRF3 but not in total IRF3 levels in anti-ZBP1 sh1- or sh2-transduced cells as compared to scr control cells (right). The protein lysates were prepared from cells with >90% transduction efficiency. (G) Immunoblotting for pIRF3/IRF3 expression on day 4 following anti-TBK1 sh1, sh2 or scr transduction in MM.1S cells. The protein lysates were prepared from the cells with >90% transduction effi- ciency. (H) Percentage green fluorescent protein-positive (%GFP+) cells after transduction with IRF3-targeting sh1, sh2 or scr control in MMCL H929 and MM.1S cells. All the time points were normalized to day 3 %GFP expression levels for each shRNA shown (n=3). (I) A representative flow-cytometric histogram of cell cycle in MMCL transduced with anti-IRF3 sh1 or sh2 or scr control. Analysis was performed on GFP+ cells day 4 after transduction and the cumulative data for H929 show cell cycle arrest in anti-IRF3 sh1- or sh2-transduced H929 cells (n=3). The error bars of all the cumulative data indicate mean ± standard error of mean. A two-tailed unpaired t-test was applied to determine the P values. *P≤0.05, **P≤0.01, ***P≤0.001. The number of experiments performed for the study is indicated separately in each panel legend.
haematologica | 2022; 107(3)
727
