
Page 172 - 2022_03-Haematologica-web
P. 172
K. Ponnusamy et al.
ABC
DE
FG
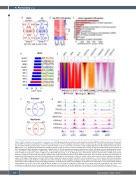
Figure 5. IRF3 regulates cell cycle genes in myeloma cells. (A) RNA-sequencing was performed with poly(A) tail-enriched RNA from FACS-purified green fluorescent protein (GFP)+ live cells of scrambled (scr) or shRNA-transduced cells. The Venn diagram shows the numbers of commonly up- and down-regulated genes among the top 50% differentially expressed genes, based on log2 fold-change to the scr control with cut-off Padj <0.05, of ZBP1-depleted and IRF3-depleted transcriptomes in MM.1S cells (n=2). (B) Heatmap showing the expression patterns of the top 132 commonly expressed genes among the top 50% differentially expressed genes of ZBP1-depleted and IRF3-depleted transcriptomes in MM.1S cells. (C) Enrichr pathway enrichment analysis for the shared 109 genes that are downregulated in com- mon upon ZBP1- or IRF3-depletion in MM.1S cells. (D) Transcription factor motif analysis of IRF3 chromatin immunoprecipitation (ChIP)-sequencing shows enrich- ment for IRF3-bound genomic regions in MM.1S cells (IRF3 ChIP-sequencing; n=2). (E) Metagene (top) and heatmap (bottom) representation of IRF3 genome-wide binding as assessed by IRF3 ChIP-sequencing in MM.1S cells along with indicated histone marks, RNA polymerase II (Pol II) binding and chromatin accessibility as assessed by ATAC-sequencing. Genomic feature annotation for each peak in the heatmap is shown on the left and the small color bar (below) indicates the genomic regions for 27,868 binding regions annotated. IRF3 binding is observed in genomic regions marked for active transcription i.e., with increased chromatin accessibility, activating chromatin marks (H3K27ac, H3K4me1/3) and Pol II binding. (F) Venn diagram showing numbers of genes predicted to be directly regulated (activated or repressed) by IRF3 in MM.1S cells as assessed by integration of IRF3 cistrome, IRF3 binding within 2 kb distance of the transcription start site, and IRF3-depleted transcriptome with cut-off Padj <0.05 using BETA-plus software. (G) IGV browser snapshots of IRF3 and Pol II binding, chromatin accessibility and histone mark enrichment at regulatory areas of several genes promoting cell cycle progression and cell proliferation. The red block on the top indicates 5 kb genome size.
728
haematologica | 2022; 107(3)
