
Page 105 - 2022_03-Haematologica-web
P. 105
Dendritic cells in myelodysplastic syndromes
A
B
C
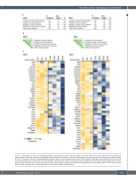
Figure 4. Leading-Edge Analysis. (A) Leading-Edge Analysis using five gene sets for both cell subsets. The tables show total number of genes that are present in a specified gene set and the number and percentage of genes that were considered to form the leading-edge subset of that gene set. (B) A set-to-set analysis for cDC2 and slan+ monocytes. Overlap in leading-edge genes between gene sets are displayed using a color intensity graph. A dark green cell indicates that sets have the same leading-edge genes. (C) Heatmap of the leading-edge subset for cDC2 and slan+ monocytes. Genes displayed are present in the leading-edge subset of all five gene sets. The heatmaps show relative expression levels per gene between healthy donor (HD) and myelodysplastic syndrome (MDS) samples. FDR: false discovery rate; GO: gene ontology; NES: normalized enrichment score; Nom P-value: nominal P-value.
haematologica | 2022; 107(3)
661
