
Page 104 - 2022_03-Haematologica-web
P. 104
N. van Leeuwen-Kerkhoff et al.
A
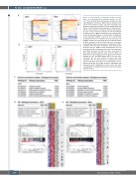
Figure 3. Transcriptomic comparison between healthy donor- and myelodysplastic syndrome-derived cell sub- sets. Three healthy donor (HD)-derived samples and four myelodysplastic syndromes (MDS)-derived samples were used for the isolation of cDC2 and slan+ monocytes and subsequent microarray analysis. (A) Hierarchical clustering, based on differentially expressed genes, of replicate sam- ples for cDC2 and slan+ monocytes. Heatmap visualization is used to show transcript clustering for the two different conditions (HD vs. MDS). (B) Volcano plots showing over- and under-expressed genes in red and green, respectively, in HD compared to MDS. A cut-off of -2.5 / 2.5 for fold- change and a P-value < 0.05 were used to show results. (C) Pathway analyses for transcripts that are under-expressed in MDS compared to HD for cDC2 and slan+ monocytes. Coding differentially expressed genes (774 genes for cDC2 and 987 genes for slan+ monocytes) were selected and imported into the STRING v10.5 bioinformatics tool. Six enriched biological processes with lowest false discovery rate (FDR) are shown for cDC2 and slan+ monocytes (in total, eight enriched pathways were found for cDC2 and 383 for slan+ monocytes). (D and E) Gene set enrichment analysis for HD- and MDS-derived cDC2 (D) and slan+ monocytes (E). For both subsets five gene sets were enriched in HD. An enrichment plot is displayed for each subset. Heatmaps show the core enriched genes (67 for cDC2 and the top 75 of 280 for slan+ monocytes) with interesting genes highlighted by black stars. GO: gene ontology; NES: normalized enrichment score; Nom P-value, nominal P-value.
B
C
D
660
haematologica | 2022; 107(3)
E
