
Page 33 - 2022_02-Haematologica-web
P. 33
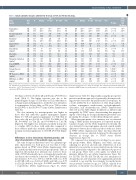
Dose intensity in ALL treatment
Table 1. Actual cumulative dosages administered for drugs on T15 and T16 by risk group. T15
T16
N Median 5th-%tile 95th-%tile CV%
T15 minus
P Value T16 Median n
<0.0001 -1100 <0.0001 -16700
1 0 <0.0001 613
Drug Risk (units) arm
N Median 5th-%tile 95th-%tile CV%
Asparaginase (U/m2)
Cyclophosphamide (mg/m2)
Cytarabine (mg/m2)
Daunorubicin (mg/m2)
Doxorubicin (mg/m2)
Vincristine (mg/m2)
Thiopurine.Induction (mg/m2)
ConsolHDMTX (mg/m2)
Dexamethasone (mg/m2)
MP Consol_to_Wk120 (mg/m2)
MTX Cont_to_Wk120 (mg/m2)
LR SR
LR SR
LR SR
LR SR
LR SR
LR SR
LR SR
LR SR
LR SR
LR SR
LR
SR
192 173
190 172
190 172
192 173
189 171
192 173
190 172
190 171
190 171
191 171
190
165
12000 8500 15500 26600 15700 40900
6% 7%
254 13100 10600 270 43300 12700
17200 3% 58700 27%
1000 917 1040 <1% 4440 1190 4650 6%
599 227 636 2% 11300 3550 12300 13%
252 1000 969 1040 <1% 269 3830 2080 4670 25%
50 25 50.3 38.4
60 57.7 179 120
60.8 38.9 52.2 19.8
51.9 2% 52.3 2%
60.9 1% 183 2%
66.1 8% 67.2 34%
253 600 295 638 4% 1 -1.03 269 9460 5510 10400 10% <0.0001 1830
254 49.4 24.7 50.9 2% 1 0.58 270 49.5 25 50.8 2% 2.07 x10⁻⁴ 0.85
250 30 29.2 30.9 1% <0.0001 30 265 162 118 182 16% 0.22 17.7
253 62.1 38.6 66.8 7% 0.33 -1.3
817 260 936 9%
269 55.3 26 67.9 253 813 354 915
29% 0.33 -3.1
11% 1 4.1 12% 0.52 16.5
813 354 918
11000 7410 14800 18500 11100 23400
1060 586 1160 1330 287 1580
51400 29600 69000 37100 9340 48600
3250 2210 4600
2440 1280 3440
10%
19% 12%
9% 22%
21% 23%
15%
17%
269 796 376
250 9970 8990 266 18400 13000
251 1020 481 265 1260 365
251 43900 22700 266 28000 8000
251 2980 1840
261 2090 854
886
10300 2% <0.0001 1020
20900 10%
1110 8% 1400 13%
61400 26% 42200 40%
3960 17%
3070 24%
0.92 94.7
6.18 x10⁻⁴ 37 1.29 x10⁻⁴ 74.2
<0.0001 7420 <0.0001 9130
<0.0001 273
<0.0001 347
Drugs excluded were prednisone from the induction phase (because of variability in formulations and documentation) and mercaptopurine and methotrexate for boys in T15 from week 120- 146 (which were not present in T16).The CV% is calculated as median absolute deviation divided by median dosage.Total of 11(drugs)x2(risk arms)=22 comparisons.Bonferroni significance threshold=0.002. T15: Total therapy 15 trial, T16: Total therapy 16 trial; Consol: consolidation; cont: continuation; HDMTX: high-dose methotrexate; CV%: percentage coefficient of variation; MP: mer- captopurine; MTX: methotrexate; wk: week.
T16 than on T15 for both the LR and SR arms (P<0.0001 for both) (Table 1). The higher exposure was due to the planned higher dosages on T16 than on T15, rather than to a change in prescribing practices, in that the dose intensities for asparaginase did not differ on T16 versus T15 for either the LR (P=1) or the SR (P=0.77) arms (Online Supplementary Table S3).
The dose intensity for mercaptopurine was higher in those who had antibodies against asparaginase (against Elspar for T15 and against pegaspargase for T16) than in those who did not (P=0.12 for T15 LR, P=0.0056 for T15 SR, P=0.00027 for T16 LR, and P=0.00014 for T16 SR) (Figure 5). The higher dose intensity was likely in response to a higher ANC in those with antibodies compared to those without antibodies, with the difference only reaching nominal statistical significance for T15 SR (P=0.032) (Figure 5).
Differences in dose intensity by inherited genetics and other characteristics of the patients (age, sex, race)
The only dosage modification based on a pharmacoge- netic characteristic for both protocols was that for thio- purines based on TPMT status (Online Supplementary Table S2), and this modification was made prospectively. Thus, as expected, the median dose intensity was lower for those with a TPMT abnormality (poor or intermediate metaboliz- ers) than for those without a defective TPMT allele (normal metabolizers): 0.73 versus 0.83 for T15 SR, 0.68 versus 0.84 for T15 LR, 0.48 versus 0.63 for T16 SR, and 0.60 versus 0.75 for T16 LR (P=0.001, P=4.3x10⁻⁴, P<0.0001, and P=1.92x10- 4, respectively) (Online Supplementary Figure S3, Online
Supplementary Table S7). Importantly, using this prospective precision medicine approach of genetically-driven prescrib- ing prevented excessive thiopurine-induced cytopenias. As a result, neither the dose intensities of other drugs (anthra- cyclines, asparaginase, methotrexate, cyclophosphamide, cytarabine, and dexamethasone) (Online Supplementary Table S7) nor the ANC (Figure 6) differed (or differed only marginally) by TPMT status, demonstrating that pinpoint- ing the correct drug for dosage adjustments prevented com- promising the dosages of other chemotherapeutic agents.
When mercaptopurine dose intensity was re-estimated using a TPMT-specific denominator for expected mercap- topurine dosages (see the Online Supplement for details), the dose intensity for mercaptopurine showed a much smaller difference between those with and those without a defect in TPMT (Online Supplementary Figure S4) than when the denominator was not adjusted downward for the expected decrease in dosage due to TPMT status (Online Supplementary Figure S5).
We compared dose intensity for all drugs by sex, ances- tral group (white, Black, Hispanic, and other), and age, adjusting for protocol and risk arm. Differences in dose intensity by race and by sex were relatively modest (data not shown), particularly compared to the differences by protocol or risk group. There were a few agents for which dose intensity differed by age (Online Supplementary Figure S6). For T15 SR, T16 SR, and T16 LR, the dose intensities for dexamethasone and vincristine were significantly inversely correlated to age and the dose intensity for methotrexate was positively correlated to age; for T15 LR, only the dose intensity of vincristine was inversely correlated with age,
haematologica | 2022; 107(2)
375
