
Page 31 - 2022_02-Haematologica-web
P. 31
Dose intensity in ALL treatment
ified conversions (i.e., pegaspargase 2,500 units/m2 were consid- ered comparable to 50,000 units/m2 of Elspar and 100,000 units/m2 of Erwinia asparaginase). Total planned dosages were identical for T15 LR and T16 LR as well as for T15 SR and T16 SR for consolidation high-dose methotrexate, cyclophos- phamide, cytarabine, daunorubicin, continuation mercapto- purine, and vincristine; they were higher on T16 than on T15 for asparaginase, and were lower on T16 than on T15 for dexam- ethasone (both LR and SR arms) and for doxorubicin (LR arms; Figure 1, Online Supplementary Table S2). In Total therapy proto- cols, particularly for the 120 weeks of continuation, dosages of therapy were adjusted or omitted if they caused toxicity (partic- ularly myelosuppression), as detailed (Online Supplementary Table S2), but therapy was not typically delayed.
Dose intensities were calculated as the delivered dosage divid- ed by the protocol-specified dosage for each risk group and pro- tocol. Dose intensity was tabulated per phase, and cumulative dose intensity was estimated as the total prescribed dosage per patient divided by the total cumulative protocol-specified dosage (Online Supplement). Absolute neutrophil count (ANC) was generally checked at least weekly throughout treatment (Online Supplement). Time to complete therapy was the time from start of first chemotherapy in induction to last dose of chemotherapy at 120 weeks.
Additional methods
Details of genetic ancestry assessment, TPMT phenotype assignment, and statistical methods are available in the Online Supplement.
Results
Differences in dosage intensity and delivered dosages between the Total 15 and Total 16 trials
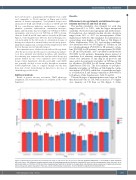
The median cumulative dose intensity for each drug ranged from 61% to 100%, with the largest interpatient variability observed for mercaptopurine and methotrexate. Post-induction, dose intensity median absolute deviations ranged from 16% to 23% for mercaptopurine (Online Supplementary Table S3). The cumulative dose intensities for several drugs were higher on T15 than on T16 (Figure 2, Online Supplementary Table S3), and median cumulative dose intensities were over 10% higher on T15 than on T16 for cyclophosphamide (P<0.0001 for SR patients), cytara- bine (P<0.0001 for SR patients), mercaptopurine (P<0.0001 for LR and SR patients), and consolidation methotrexate (P<0.0001 for LR patients). Examining phases instead of cumulative dose intensity, mercaptopurine exhibited the lowest dose intensities of any drug in all protocols and arms, and its dose intensity was higher on T15 than on T16 for all phases (P<0.0001 for all) except induction (Online Supplementary Table S4). The dose intensity of cyclophos- phamide was higher on T15 than on T16 during the contin- uation phase (P<0.0001), while that of cytarabine was high- er at reinduction II and during continuation (P<0.0001 for both phases; Online Supplementary Table S5 and S6).
Tolerated dosages of mercaptopurine were lower on T16 than they had been on T15, with as much as 27% higher dose intensity on T15 than on T16 (Figure 3, Online
Figure 2. Administered cumulative dose intensities for drugs on T15 versus T16, by risk arm. The only significant differences (***P<0.0001) in dose intensities with more than a 10% difference between protocols were for cyclophosphamide and cytarabine (standard-risk arms) and for mercaptopurine (both risk arms), all of which were higher on T15 than on T16 (see Online Supplementary Table S3 for details on all drugs). Bars and whiskers indicate medians and median absolute devi- ations among each patient population. There was a total of 16 statistical comparisons, thus the Bonferroni significance threshold=0.003.
haematologica | 2022; 107(2)
373
