
Page 32 - 2022_02-Haematologica-web
P. 32
S.E. Karol et al.
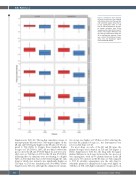
Figure 3. Thiopurine dose intensity by phase in T15 versus T16. The box and whisker plots show the quartiles and nonoutlier ranges. Dose intensi- ty was significantly lower on T16 than on T15 (P<0.0001) for all phas- es except induction (see Online Supplementary Table S4 for exact P values). The largest difference was 27% during continuation weeks 10- 16 in standard-risk patients. There was a total of 10 statistical compar- isons, thus the Bonferroni signifi- cance threshold=0.005.
Supplementary Table S4). The median cumulative dosage of mercaptopurine delivered was 7,420 mg/m2 higher on the LR arm and 9,130 mg/m2 higher on the SR arm of T15 com- pared to T16 (Table 1). Despite these markedly higher dosages on T15 (Table 1), ANC did not differ between the protocols for the LR arm (P=0.18) (Figure 4), and were actu- ally lower on T16 than on T15 for the SR arm (P<0.0001), indicating that our clinicians were not titrating to a higher ANC on T16 than they had on T15. Interestingly, the only drug for which dose intensity was significantly higher on T16 than on T15 was dexamethasone (P<0.0001) (Online Supplementary Table S3), although the administered cumula-
tive dosage was higher on T15 than on T16, reflecting the fact that the planned dosage (i.e., the denominator) was lower on T16 than on T15.
For most drugs on each of the LR and SR arms, the planned dosages were identical on T15 and T16 (Figure 1, Online Supplementary Table S2); the drug with the largest planned differences in dosages between the two protocols was asparaginase, with an 8% planned increase in the LR arms and a 34% increase in the SR arms on T16 compared to T15. In actuality, asparaginase was the only drug for which the planned or administered dosages were higher on T16 than on T15, with higher cumulative dosages given on
374
haematologica | 2022; 107(2)
