
Page 34 - 2022_02-Haematologica-web
P. 34
S.E. Karol et al.
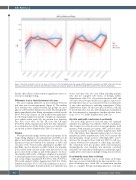
Figure 4. Absolute neutrophil count by risk group on T15 versus T16. The graphs show the average of fitted absolute neutrophil count (ANC; cells/mm3) data per phase per patient with thick solid lines representing the median per risk group. Based on 46,310 and 64,549 ANC records for T15 and T16, respectively.
but the effect did not reach statistical significance after cor- rection for multiple testing.
Differences in dose intensity between risk arms
The most striking difference in dose intensity between risk arms was for mercaptopurine (Figure 2). The median dose intensity was similar between risk groups for most phases on T15 (Online Supplementary Table S8) including the phase immediately after Elspar asparaginase ended (weeks 20-47, P=0.1). In contrast, on T16, in the weeks immediate- ly following reinduction and the completion of pegaspar- gase (which ended week 29), the median dose intensity was 41% versus 69% for the SR versus the LR arms (P<0.0001) (Online Supplementary Table S9). The cumulative dose intensities for all the drugs by protocol and risk arm are shown in Online Supplementary Tables S10 and S11.
Relapse
We explored relationships between dose intensities for all drugs during all phases and cumulatively, and ANC for all phases and cumulatively, and treatment outcomes. No sig- nificant associations between dose intensity or ANC and outcomes were observed after adjusting for multiple test- ing. Only one dose intensity or ANC variable was nominal- ly associated with outcome in the same direction for both protocols in both continuous and tertile analyses: for those who finished 120 weeks of therapy: a higher dose intensity for mercaptopurine was nominally associated with a higher risk of any relapse (unadjusted P=0.03 for T15, P=0.07 for T16, tertile analysis) (Online Supplementary Table S12, Online Supplementary Figure S7). For T15, this tendency for an asso- ciation between higher mercaptopurine dose intensity and
worse outcomes was also true when including patients who did not complete 120 weeks of therapy (Online Supplementary Table S12). Associations between ANC and outcomes were not reproducible across phases or protocols. Notably, there was no association between dose intensities of any other medications, including asparaginase (Online Supplementary Figure S8) and outcomes; however, it should be noted that there was also little interpatient variability in the dose intensity for asparaginase (median absolute devia- tions, 1% to 7%; Online Supplementary Table S3).
Absolute neutrophil count versus dose intensity
For each drug, protocol, and risk arm, we analyzed whether dose intensity was related to ANC for each phase. The strongest associations were for mercaptopurine; in all instances with nominal associations, ANC and dose inten- sity were positively correlated (Online Supplementary Table S13). This reflects that clinicians followed protocol recom- mendations (Online Supplementary Table S1) to increase the mercaptopurine dosage in those with high ANC, and to decrease the dosage for those with low ANC. For all asso- ciations between dose intensity of other drugs and ANC, the correlations were also positive, with a few exceptions; dexamethasone dose intensity was inversely correlated with ANC in some phases (although not statistically signif- icantly after corrections for multiple testing; data not shown).
Dose intensity versus time on therapy
Although the practice was to avoid delays in therapy,
there was observed variability in the time required to com- plete all therapy up to week 120 of continuation (median time to complete therapy including induction, consolida-
376
haematologica | 2022; 107(2)
