
Page 209 - 2022_02-Haematologica-web
P. 209
Letters to the Editor
AB
CDE
FGHI
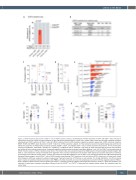
Figure 1. STAT3 mutations discovered in CD8+ T cells of HTLV-2 positive subjects. (A) Prevalence of STAT3 mutations in CD4+ and CD8+ T cells of human T- cell leukemia virus type 2 (HTLV-2) positive subjects (n=30) and HTLV-2 negative subjects (n=35). Four (13.3%; Fisher’s exact test P=0.04) of 30 HTLV-2 positive individuals had STAT3 mutations in CD8+ T cells. (B) STAT3 mutations found in HTLV-2 positive subjects by amplicon sequencing. STAT3 mutations (insertion, N647I, Y640F and D661Y) were discovered in CD8+ T cells from 4 HTLV-2 positive subjects. (C) Flow cytometry based immunophenotyping was performed to identify the proportion of differentiated, putatively cytotoxic (CD56+, CD57+, and CD16+) CD8+ T cells in 9 HTLV-2 positive blood donors. For the immunophe- notyping, anti-CD3 APC, -CD45 V500, -CD4 APC-H7, -CD8 PE-Cy7, -CD16 PerCP-Cy5.5, -CD56 FITC, and -CD57 PE, were used. Each dot represents one individual, and horizontal lines indicate median values. Statistically significant difference was evaluated using Mann-Whitney U test. (D) The CD8+ T-cell clonality index by STAT3 mutation status in 8 HTLV-2 positive blood donors. The clonality index was calculated using ImmnoSEQ Analyzer software (Adaptive Biotechnologies, WA, USA) as 1 minus Shannon entropy normalized by the logarithm of the number of productive T-cell receptor (TCR) sequences. Each dot represents 1 individual, and horizontal lines indicate median values. P-values were evaluated using Mann-Whitney U test. (E) CD8+ T-cell repertoire analyzed with TCRb deep sequencing (Adaptive Biotechnologies). Sorted CD8+ T cells of HTLV-2 positive cases bearing STAT3 mutations (n=4) and without STAT3 mutations (n=4) were used. Variant allele frequency (VAF) was analyzed by amplicon sequencing. The graph shows top 3 TCR clones in each sample. (F-I) (F) Age distribution, (G) HTLV-2 proviral load in copies per peripheral blood mononuclear cells (PBMC), (H) white blood cells count and (I) lymphocytes count within HTLV-2 negative subjects (HTLV2-), HTLV-2 positive subjects without STAT3 mutations (No STAT3Mut) and HTLV-2 positive subjects harboring STAT3 mutations (STAT3Mut). Each dot represents one individual. P-values were calculated using Mann–Whitney U test (No STAT3Mut vs. STAT3Mut). Horizontal lines indicate median values. Ref: reference base; Var: variant base.
haematologica | 2022; 107(2)
551
