
Page 285 - 2022_01-Haematologica-web
P. 285
RINF maintenance of SMAD7 sustains human erythropoiesis
bring insight into molecular barriers that may prevent effec- tive erythropoiesis.
Our in vitro erythropoiesis experiments demonstrated that RINF is expressed in human erythroid progenitors (i.e., BFU-E and CFU-E) and proerythroblasts (ProE) but not in
AB
C
DE
the last stages. Loss of RINF expression does not affect cell viability or cell proliferation but accelerates erythroid mat- uration, and noticeably reduces RBC expansion. The aver- agereductioninRBCnumberwasestimatedat~45%insix experiments (Figure 2F) or one population doubling (i.e.,
F
G
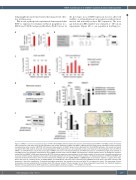
Figure 5. SMAD7 is a direct transcriptional target of RINF. (A) The MigR1 retroviral system was used to constitutively express RINF in the K562 cell line. A few days after transduction, cells were sorted for GFP expression and relative expression of RINF and SMAD7 mRNA levels were measured by quantitative reverse transcrip- tase polymerase chain reaction (qRT-PCR). (B) Schematic representation of SMAD7 gene structure (deduced from the ENCODE database). CpG islands and primer set regions (R0 to R5) used for chromatin immunoprecipitation (ChIP) experiments are also indicated as well as the distance to the transcription start site (TSS) of SMAD7. (C) ChIP-qPCR bars indicate the percentage of SMAD7 promoter co-immunoprecipitated by anti-RINF (left panel) or anti-H3K4me3 (right panel) antibody in the K562 cell line. (D) Schematic representation of the pBABE retroviral vector used for SMAD7 overexpression or empty cassette control. (E) Histograms represent- ing the RINF and SMAD7 mRNA levels detected by qRT-PCR. Values are expressed in percentage of the shControl condition. A Student t-test (unpaired) was performed to assess whether relative expression values were statistically significant from those of the shControl condition. (F) Relative expression of RINF and SMAD7 was measured by western-blot analysis after retroviral transduction of K562 cells with pBABE/SMAD7 or pBABE/Empty and puromycin selection (1 mg/mL) for 5 days. HSC70 was used as a loading control. (G) K562/SMAD7 and K562/Empty cells were then transduced with pTRIPDU3 lentiviral vector. Cells were sorted for GFP expression 2 days after transduction. To analyzed hemoglobin production, the benzidine test was used after 24 h of exposure to hemin. The percentage of benzi- dine-positive cells was established by counting at least 300 cells per sample. Pictures represent one of three independent experiments. For statistical analysis a Student t-test was performed for qPCR experiments, and hemoglobin production analysis (**P=0.0026; ns: P>0.05).
haematologica | 2022; 107(1)
277
