
Page 235 - 2022_01-Haematologica-web
P. 235
Baseline SUVmax in FL and tumor proliferation
this SUVmax-to-Ki-67 index association suggests that 18FDG uptake in FL patients at baseline reflects tumor cell prolif- eration.
Baseline SUVmax could be influenced by tumor cell muta- tion profiles
In the 33 available FL samples from the training cohort, targeted next-generation sequencing (NGS) identified 243 non-synonymous alterations in 32 genes (Figure 6A; Online Supplementary Table S3). The most frequently mutated genes were KMT2D, CREBBP and BCL2 (22%, 14%, and 15% of total variants, respectively), which were detected in 82%, 73% and 58% of cases, respectively. A recurrent missense mutation in EZH2 tyrosine 646 (Y646) was also found in 21% of cases. Altogether, 94% of patients har- bored mutations involved in genes from epigenetic regula-
A
B
tion pathways (48.5% of total variants), whereas muta- tions in apoptotic pathways (16% of total variants) or in genes involved in immune response (21% of total variants) were less frequent (64% and 70% of patients) (Figure 6B). The mutational frequency in these altered pathways did not vary with the level of SUVmax (Figure 6C). However, FOXO1 mutations (n=2 of 33) were exclusively detected in patients with high SUVmax (SUVmax>14.5), while MFHAS1 (n=2), MYC (n=1), and TP53 (n=6) mutations were only observed in patients with low SUVmax (SUVmax<6.5) (Online Supplementary Figure S5).
The same analyses in the validation cohort (n=18 avail- able FL samples) unveiled 132 non-synonymous alterations in 32 genes. The most frequently mutated genes were CREBBP, KMT2D and MEF2B (18%, 13%, and 6% of total variants, respectively, occurring in 78%, 66%, and 44% of
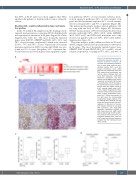
Figure 5. Correlation between tumor proliferation signatures and SUVmax in follicular lymphoma samples. (A) The heat map represents quantifica- tion of whole body maximum stan- dardized uptake (SUVmax) and five sample enrichment score (SES) gene sets for proliferative index and DNA repair/tumor proliferation sig- natures (Gene Ontology [GO] cell cycle DNA replication, G2M DNA replication checkpoint, and base excision repair [BER]). Each column represents one patient. (B) Example of quantification of Ki-67 staining on two representative cases. Panels on the left show the original picture of Ki-67 staining (upper panel: Ki-67 <10%; original magnification 100x; scale bar =50 μm; lower panel: Ki-67 ≥10%; original magnification 100x; scale bar = 50mm) and panels on the right show the corresponding computerized image analysis of Ki- 67 staining (Ki-67 positive cells are purple and uncolored cells are Ki-67 negative). (C) Box plots of correla- tions between SES for GO cell cycle DNA replication (left), G2M DNA replication checkpoint (middle) or DNA repair gene sets (BER) (right) with the percentage of Ki-67 prolifer- ative index by immunochemistry. (D) Correlation between SUVmax level and Ki-67 staining in follicular lymphoma samples from the training and vali- dation cohorts.
C
D
haematologica | 2022; 107(1)
227
