
Page 234 - 2022_01-Haematologica-web
P. 234
C.Rossi et al.
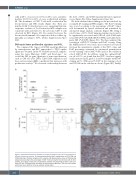
cells) in 20% of cases, low (<10%) in 40% cases, and inter- mediate (10-30%) in 40% of cases as illustrated in Figure 4B. The abundance of CD8+ T cells in FL correlated in the deconvolution and IHC results (Figure 4C). They also matched with T-cell activation scores, suggesting that tran- scriptomic evidence of T-cell activation in FL samples was consistent with and related to the cytotoxic CD8+ T cells observed by IHC (Figure 4C). By contrast however, the deconvoluted immune cell composition did not differ sig- nificantly according to SUVmax (Online Supplementary Figure S3B).
DNA repair/tumor proliferation signatures and SUVmax
We compared the tumor cell DNA repair/proliferation by transcriptomic and IHC approaches to 18FDG uptake signatures obtained. In the 38 available frozen FL samples, using the Gene Ontology (GO)22 and Reactome,27 we scored the SES for gene signatures of tumor proliferation, such as GO cell cycle DNA, G2M DNA replication and base excision repair (BER), a pathway that increases with proliferative activity.24 We observed a relationship between
the level of SUVmax and DNA repair/proliferation signature scores (Figure 5A; Online Supplementary Figure S4).
We then validated these findings at the protein level by scoring Ki-67 staining in FFPE samples. The Ki-67 staining was scored according to the percentage of Ki-67+ tumor cells determined by optical evaluation and quantified by automated image analysis solutions (Figure 5B). Using a cutoff value of 10%, Ki-67 immunostaining was found to be significantly associated with GO cell cycle DNA repli- cation SES (P=0.013), BER SES (P=0.0086) and G2M check- point SES (P=0.0059) (Figure 5C). We then analyzed the correlation of PET-CT baseline and Ki-67 scoring. Using the MINE method23 we found a non-correlated association between the quantitative variable of the SUVmax value and Ki-67 percentage estimated by automated quantification for the training cohort (MIC=0.59) and for the validation cohort (MIC=0.35). In addition, using the optimal Ki-67 cut-off of 10%, we found that the SUVmax level was signifi- cantly increased in FL grade 1-2 and 3A samples with Ki-67 staining ≥10% (Wilcoxon P=0.007 in the training cohort and P=0.006 in the validation cohort) (Figure 5D). Finally,
AB
C
Figure 4. Immunohistochemical validation of sample enrichment score for T-cell activation in follicular lymphoma samples. (A) Immunohistochemical (IHC) quantification of CD3, CD8 and CD163 staining in follicular lymphoma (FL) samples. (B) Representative cases of CD8 staining categorized according to the percentage of CD8+ T cells among the total immune cells (5-10%, 10-30%, and >30%). (C) Box plots of correlations between the percentage of CD8+ T cells scor- ing by IHC with CD8 abundance quantified by deconvolution algorithm24 (left) and with sample enrichment score (SES) for immune cytotoxic activity (right) .
226
haematologica | 2022; 107(1)
