
Page 232 - 2022_01-Haematologica-web
P. 232
C.Rossi et al.
A
B
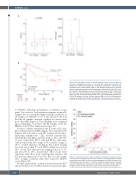
for IEGS33, indicating up-regulation of immune escape genes. The score for T-cell activation signature in these FL samples was also among the highest. Finally, scatterplots of all samples for ‘IEGS33’ versus ‘T-cell activation’ showed that the FL samples clustered together, in contrast with most other NHL (Figure 2). These findings were confirmed upon datamining of another 160 FL samples from the PRIMA study21(Online Supplementary Figure S1).
In order to further characterize the IE status of FL sam- ples at the protein level, FFPE samples were stained for ICP markers and were then scored. PD-1 expression in tumor- infiltrating lymphocytes (TIL) showed perifollicular, intrafollicular and diffuse patterns in 46%, 20% and 34% of cases, respectively. PD-1+ cells and PD-L1+ cells repre- sented, respectively, 16% (range, 2-30%) and 5% (range, 2- 10%) of CD3+ immune cells (Figure 3A). LAG3 staining was seen in less than 5% and TIM3 staining was seen in 15% of total CD3+ immune cells (ranging from 2% to 5% and from 5% to 15%, respectively). These results were consistent with those from transcriptomic analyses. All ICP protein expressions scored by IHC in each sample were strongly correlated with their respective IEGS33 scores (Figure 3B).
We then analyzed the correlation between baseline PET and molecular scores for IEGS and T-cell activation signa-
Figure 2. Functional immune status of follicular lymphoma samples from the training cohort and previously published lymphoma cohorts. Dot plot of sample enrichment scores (SES) for the immune escape gene set (IEGS33) versus T-cell activation gene set (defined in 24) in 38 frozen follicular lymphoma (FL) samples from our training cohort (purple dots) and 148 FL (red dots) among 1,446 non Hodgkin lymphoma (NHL) (grey dots) public microarrays datamining analysis.
Figure 1 Clinical impact of SUVmax and total metabolic tumor volume at positron emission tomography baseline in the follicular lymphoma patients. (A) Distribution of whole body maximum standardized uptake (SUVmax) (left) and total metabolic tumor volume (TMTV) (right) in 132 follicular lymphoma (FL) patients without progression/relapse or with progression/relapse 24 months after start- ing treatment. (B) Progression-free survival (PFS) according to SUVmax threshold of 14.5 since the start of treatment. Kaplan-Meier estimates of PFS in the whole cohort (n=132). An optimal threshold was set to separate patients into high-risk (14% of FL patients; n=19 of 132) and low-risk (86%, n=113 of 132) groups for progression/relapse (P=0.00046). Hi: high SUVmax; HR: hazard ratio, Lo: low SUVmax.
224
haematologica | 2022; 107(1)
