
Page 181 - 2022_01-Haematologica-web
P. 181
VDAC-driven mitophagy in human erythropoiesis
A
BC
D
E
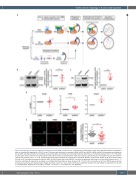
Figure 5. Autophagy is impaired in VDAC1 scramble short hairpin RNA-transduced cells. (A) Schematic representation of the role of the PINK1/Parkin and NIX path- ways in mitochondrial degradation. (B) LC3-I and LC3-II levels were evaluated in scramble shRNA (shSCR) and VDAC1 shRNA (shVDAC1)-transduced erythroblasts at day 10 (D10) and representative immunoblots are presented (left). LC3-II levels were normalized to b-actin with levels in control cells arbitrarily set at “1” (n=5) (right). (C) p62 levels were monitored and representative immunoblots (left) and quantifications (right) are presented. p62 levels were normalized to b-actin with levels in control cells arbitrarily set at “1” (n=6). (D) p62 protein level was evaluated by flow cytometry on basophilic (BasoE), polychromatic (PolyE) (n=8) and orthochromatic (OrthoE) (n=3) and mean fluorescence intensity (MFI) of shSCR (black dots) and shVDAC1 (red dots) are presented with levels in control cells arbitrarily set at “1”. Gates for erythroblasts populations are based on a4-integrin/Band3 profiles as shown in Figure 1D. *P<0.05. (E) Co-localization of LC3 and TOM22 was monitored by confocal microscopy and representative images are shown. Scale bar =3 mm. (left) The Pearson coefficient between LC3 and TOM22 are presented for 30 cells in a representative experiment (n=3) (right). *P<0.05, **P<0.01, ****P<0.0001. ns: non-significant.
haematologica | 2022; 107(1)
173
