
Page 180 - 2022_01-Haematologica-web
P. 180
M. Moras et al.
(OXPHOS), was lower in shVDAC1-transduced ery- throblasts for both basal levels and maximal respiration (Figure 4F). In accord with the lower OXPHOS, intracel- lular ATP levels were significantly lower in shVDAC1- transduced cells than control cells (Figure 4G). We also measured mitochondria membrane potential and ROS accumulation at day 10 and showed no difference in cells transduced with shVDAC1 compared to the shSCR (Online Supplementary Figure S4), suggesting an adapta- tion of the cell to compensate for mitochondria changes of metabolism upon VDAC1 downregulation. Thus, decreased expression of VDAC1 attenuates mitochondr-
ial function, resulting in a diminished energetic state of the differentiating erythroblast.
Delayed mitochondrial clearance in late-stage ery- throblasts with downregulated VDAC1 is due to a defective recruitment of autophagosomal membranes
Given that VDAC1 has been shown to regulate mitophagy in non-erythroid cell lines,18-20 we hypothesized that VDAC1 downregulation could impair mitophagy in human erythroblasts as well. While the autophagy-medi- ated lipidation of LC3-I to LC3-II in the autophagosome membrane was not altered upon VDAC1 downregulation
AB
DE
FG
C
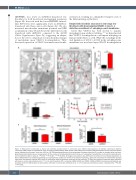
Figure 4. Mitochondria morphology is altered and oxidative phosphorylation is attenuated upon VDAC1 downregulation. (A) Sample transmission electron microscopy (TEM) images of erythroblasts at day 10 (D10) of differentiation (black arrows show endoplasmic reticulum [ER]-mitochondria contact site) with swollen cristae indicated by red arrows. Scale bar =200 nm. (B) TEM-based quantification of the percentage of altered cristae and (C) number of rounded (white) and elon- gated (black) mitochondria by mm2 are presented. (D) The number of mitochondria-ER contact site by mm2 is presented. Quantification in 20 cells for panels B and C and nine different cells for panel D. *P<0.05, ***P<0.001, ****P<0.0001. (E) Oxygen consumption rates (OCR) were monitored in the indicated populations at D10 of differentiation by Seahorse technology and representative profiles are formed (n>3 technical replicates). Data were normalized to mitochondrial quantity using mean fluorescence intensity (MFI) values of mitotracker deep red previously measured by flow cytometry. (F) Basal and maximum respiration were quantified with levels in control cells arbitrarily set at “1” (n=3). (G) Intracellular ATP in scramble shRNA (shSCR) and VDAC1 shRNA (shVDAC1)-transduced erythroblasts was evaluated at D10 of differentiation by luminometry with levels in control cells arbitrarily set at “1” (n=3). Data are presented as means ± standard error. *P<0.05, ***P<0.001.
172
haematologica | 2022; 107(1)
