
Page 183 - 2022_01-Haematologica-web
P. 183
VDAC-driven mitophagy in human erythropoiesis
We recently demonstrated that TSPO1 downregulation
also affects mitochondria clearance with no effect on the
erythroblasts’ differentiation kinetics,38 raising the possi-
bility that this phenotype is mediated through the ous study on mice.39 Transcriptome analyses in human VDAC1-TSPO1 OMM complex. erythroblasts detected an upregulation, starting from the
AB
CD
E
In addition, our findings suggest that the canonical PINK1/Parkin pathway may play an important role dur- ing human erythropoiesis, confirming in humans a previ-
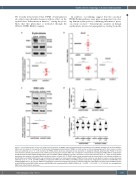
Figure 6. Lower PINK1 protein levels upon VDAC1 downregulation. (A) PINK1 levels were evaluated by immunoblot in the indicated conditions at day 10 of differen- tiation and normalized to the quantity of mitochondria (housekeeping mitochondrial TOM40) on total number of cell (housekeeping b-actin) (top). Levels in control cells were arbitrarily set at “1” (n=5) (bottom). (B) PINK1 protein level was evaluated by flow cytometry on basophilic (BasoE), polychromatic (PolyE) (n=8) and orthochromatic (OrthoE) erythroblasts (n=3). PINK1 mean fluorescence intensity (MFI) was normalized to mitochondrial housekeeping TOM22 MFI in erythroblasts transduced with scramble shRNA (shSCR) (black dots) and VDAC1 shRNA (shVDAC1) (red dots), with levels in control cells arbitrarily set at “1”. Gates for erythroblasts populations are based on a4-integrin/Band3 profiles as shown in Figure 1D. (C) PINK1 protein levels were evaluated by immunoblot in the indicated conditions in shSCR-K562 and shVDAC1-K562 cells and normalized to the quantity of mitochondria marker TOM40 on total number of cell (β-actin). Levels in control cells were arbitrarily set at “1” (n=4). (D) PINK1/TOM22 co-localization (MPI ratio from PINK1 and TOM22 signals) assessed by imaging flow cytometry of shSCR-K562 and shVDAC1-K562 cells (n =3). (E) LC3/TOM22 co-localization assessed by imaging flow cytometry (myeloma prognostic index [MPI] ratio from LC3 and TOM22 signals) of shSCR-K562 and shVDAC1-K562 cells and shSCR-K562 cells transfected with a PINK1 siRNA (n=3). *P<0.05, ***P<0.001, ****P<0.0001. ns: non-significant; OMM: outer mitochondrial membrane.
haematologica | 2022; 107(1)
175
