
Page 205 - 2021_12-Haematologica-web
P. 205
Letters to the Editor
A
B
C
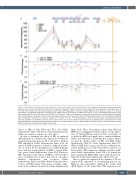
Figure 3. JQ1 changes interaction frequencies between the locus control region and the b-globin genes. (A) Chromosome conformation capture quantitative polymerase chain reaction (3C-qPCR) quantification of interaction frequencies between the locus control region (LCR) and segments of the b-globin locus in TF-1 cells after treatment with JQ1 (red), erythropoietin (EPO) (blue), EPO+JQ1 (green) vs. dimethyl sulfoxide (DMSO) (control, black) for 3 days, (n=3). (B) Log2 (fold-change) and statistical significance comparing JQ1 vs. DMSO control (red) and EPO vs. DMSO control (blue). (C) Log2 (fold-change) and statistical signifi- cance comparing EPO+JQ1 vs. EPO (green) and EPO+JQ1 vs. JQ1 (purple). Track on top indicates chromosomal gene positions and the DNA fragments generated from an EcoRI digestion. Replicates included have EcoRI digestion efficiency >60% at all control sites. HS: DNase hypersensitivity site. The EcoRI-generated frag- ment containing the bait primer is shown as a yellow bar. *P<0.05, *P<0.01, ***P<0.001 (Student’s t-test). A genomic region containing no EcoRI site (chr7:117,293,465-117,293,547) was used as internal control for the amount of input DNA. All chimeric fragment quantifications was normalized to the control region quantification of the respective experimental conditions. Since BET inhibition results in global changes in genomic structure, we were unable to identify a genomic region as a reliable control region for this study.
effects to JQ1 in both K562 and TF-1 cells (Online Supplementary Figure S1D and E), demonstrating that the ability to reactivate e/g-globins is a class effect.
In order to determine the effects of JQ1 on erythroid differentiation, we examined the expression of erythroid- and myeloid-specific genes in TF-1 cells with or without EPO stimulation (Online Supplementary Figure S2A). As expected, EPO treatment resulted in erythroid matura- tion as shown by the upregulation of erythroid-lineage genes and the downregulation of HSPC or myeloid-lin- eage genes (Online Supplementary Figure S2A). However, JQ1 only mirrored the effects of EPO in a subset of these genes, including most of those that encode cell surface markers, transporters, and receptors (Online Supplementary Figure S2A). JQ1 exhibited opposite effects to those of EPO in many of the genes encoding compo- nents of the erythroid cytoskeleton (Online Supplementary
Figure S2A). These observations indicate that JQ1 and EPO have overlapping but distinct effects on the expres- sion of erythroid-lineage genes, and the reactivation of e/g-globins by BETi is not purely due to erythroid differen- tiation and maturation. Transcriptome analyses further revealed the distinct effects of JQ1 and EPO (Online Supplementary Table S1; Online Supplementary Figure S2). Whereas EPO induces genes involved in erythropoiesis- related pathways (e.g., heme-biosynthesis and iron ion homeostasis), JQ1 suppresses immune-activation path- ways (Online Supplementary Figure S2B to E). Among the genes regulated by EPO or JQ1, only a small subset is reg- ulated by both (Online Supplementary Figure S2F to G).
Since e/g-globins are suppressed by a number of TF, we examined the expression of corresponding genes in our RNA-seq data and further validated the results with qPCR (Figure 2). We found that MYB expression was
haematologica | 2021; 106(12)
3225
