
Page 204 - 2021_12-Haematologica-web
P. 204
Letters to the Editor
ABCD
EFGH
IJ
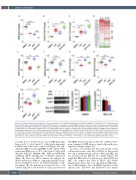
Figure 2. JQ1 downregulates known inhibitors of fetal hemoglobin. (A to C) qPCR quantification of (A) MYB, (B) miR-15A, (C) miR-16-1, in TF-1 cells after treat- ment with JQ1 (red), erythropoietin (EPO) (blue), EPO+JQ1 (green) vs. dimethyl sulfoxide (DMSO) (control, black) for 3 days. (D) Heatmap representing RNA sequencing quantification of expression changes (log2 fold-changes in FPKM) of known miR-15A and miR-16-1 targets in JQ1 treated TF-1 cells vs. control, with or without EPO. Log2 fold-change ranges from -4 (red, suppressed by JQ1) to 4 (green, induced by JQ1). Genes with low expression (FPKM<1) were excluded or represented with gray box. (E to I) qPCR quantification of (E) IKZF1 (encodes IKAROS), (F) NR2F2 (encodes COUP-TF2), (G) GATA1, (H) BCL11A, and (I) KLF1 in TF-1 cells after treatment with JQ1 (red), EPO (blue), EPO+JQ1 (green) vs. DMSO (control, black) for 3 days. (J) Western blots for GATA1 and BCL11A with corre- sponding loading controls. Quantifications of signal intensity, normalized to loading controls, are shown as bar graphs to the right of the western blots. N=3 for panels (B), (C), and (J). N=2 for panel (D). N=4 for all other panels. *P<0.05, **P<0.01, ***P<0.001, n.s.: not statistically significant (Student’s t-test).
to nearly 20% as well as the decrease in HBB transcripts from over 30% to less than 20% of all b-globin transcripts in JQ1 treated cells versus control cells (Figure 1A), indi- cating that JQ1 is reactivating HBE1 in this cell line. RNA sequencing (RNA-seq) on TF-1 cells treated 3 days with dimethyl sulfoxide (DMSO), JQ1, EPO, and EPO+JQ1 confirmed qPCR quantification of b-globin expression (Figure 1B). Moreover, JQ1 treatment also induced the adult α-globin genes HBA1/2, suggesting that BETi treat- ment is unlikely to lead to an α-thalassemia-like condi- tion (Figure 1B). We performed western blots for g- and e-globins using TF-1 cells treated for 3 days, and observed
that HBE1 protein was increased by the combined treat- ment compared to EPO alone, as expected given the gene expression changes (Figure 1F).
In order to test whether this effect was specific to this cell line and/or was a class effect of BETi, we first treated two other erythroleukemia cell lines, K562 and HEL, and one myeloid cell line (HL-60), in a similar fashion. We found that JQ1 induced e/g-globin genes only in K562 and HEL cells, without any effect in HL-60 cells (Online Supplementary Figure S1A to C) and without EPO induc- tion of differentiation. Two other BETi currently tested in clinical trials (CPI-0610 and PLX51107) had similar
3224
haematologica | 2021; 106(12)
