
Page 203 - 2021_12-Haematologica-web
P. 203
Letters to the Editor
BET inhibitors enhance embryonic and fetal globin expression in erythroleukemia cell lines
Five genes encoding the human b-globins are located in a gene cluster on chromosome 11p15.4 (b-globin locus): 5’-HBE1 (e)-HBG2 (Gg)-HBG1 (Ag)-HBD (d)-HBB (b)-3’. These genes are expressed in distinct developmental stages, with transitions controlled by a series of transcrip- tional switches regulated by the interplay between local chromatin structure and erythroid-specific transcription factors (TF).1,2 Locally, expression of each b-globin is influ- enced by the spatial proximity of its promoter to the enhancer-rich locus control region (LCR).1,2 In addition to chromatin looping, a number of TF, including GATA1, BCL11A, COUP-TF2, NuRD, and MYB, specifically repress the expression of embryonic and fetal e/g-globins.1,3,4 Furthermore, MYB mRNA is targeted for degradation by microRNA (miR) miR-15A and miR-16-1.5
In mammals, the bromodomain and extra-terminal domain (BET) family consists of histone readers with two acetyl-lysine binding bromodomains (BD1 and BD2), including the ubiquitously expressed BRD2, BRD3, BRD4, and the germ cell-specific BRDT, that are crucial for epigenetic regulation of gene expression through recruitment of the transcription machinery.6 Previous
studies have established that BET inhibitors (BETi) dis- rupt adult b-globin expression mediated by GATA1 in mouse G1E cells7 and induce hemoglobin production in the UT7 human erythroid cell line.8 However, the effects of BETi on the transcription regulation of genes in the b-globin locus have not been evaluated comprehensively. Here, we demonstrate the ability of BETi to reactivate embryonic and fetal e/g-globins in erythroleukemia cell lines.
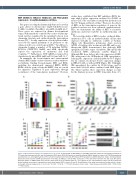
We tested the ability of BETi to induce erythroid differ- entiation in TF-1 cells, an erythroleukemia cell line that expresses virtually no embryonic e-globin at baseline (Figure 1A). Quantitative polymerase chain reaction (qPCR) of b-globins after treatment with JQ1 and/or ery- thropoietin (EPO) demonstrated that although EPO upregulated all three types of b-globins, JQ1 specifically reactivated HBE1, embryonic e-globin (Figure 1). Although JQ1 alone did not affect the expression of HBB, JQ1 antagonized the EPO-induced HBB upregulation, reducing the expression of adult b-globin by 50% (Figure 1C). In contrast, we did not observe expression changes in HBG1/2 with or without EPO (Figure 1D). Strikingly, JQ1 upregulated the e-globin by 15-fold alone, and by more than 200-fold when combined with EPO (Figure 1E). Taken together, these expression changes account for the dramatic increase in HBE1 transcripts from <1%
AB
CDEF
Figure 1. JQ1 specifically induces the ε-globin gene in TF-1 cells. (A) Percentage of HBB, HBG1/2, and HBE1 transcripts relative to total b-globin transcripts in TF-1 cells after treatment with JQ1 (red), erythropoietin (EPO) (blue), EPO+JQ1 (green) vs. dimethyl sulfoxide (DMSO) (black) for 5 days (n=3). (B) RNA sequencing quantification of α- and b-globin genes in TF-1 cells after treatment with JQ1 (red), EPO (blue), EPO+JQ1 (green) vs. DMSO (black) for 3 days. (C-E) Quantitative polymerase chain reaction (qPCR) quantification of (C) HBB, (D) HBG1/2, and (E) HBE1 expression in TF-1 cells after treatment with JQ1 (red), EPO (blue), EPO+JQ1 (green) vs. DMSO (black) for a total of 5 days (D1-5) (n=3). (F) Western blots of g- and e-globins in TF-1 cells treated for 3 days. The day at which the protein extracts were made is indicated by a black arrow labeled “WB” in panels (D and E). Quantification of the target normalized to loading control is shown to the right of the gel images (n=3). In (A, C to E), *P<0.05, **P<0.01, ***P<0.001 (Student’s t-test). In (B), * false discovery rate (FDR) <0.05, **FDR <0.01, ***FDR <0.001.
haematologica | 2021; 106(12)
3223
