
Page 55 - 2021_10-Haematologica-web
P. 55
Clinical significance of chromatin-spliceosome AML
achieve CR because of early death or chemoresistance; these patients had a dismal 1-year OS (17%) (Online Supplementary Figure S1).
We investigated factors affecting the probability of achieving CR (accounting for both induction cycles) by
performing univariate analysis within each AML catego- ry. In de novo AML, a significantly negative impact was observed for advanced age, impaired performance sta- tus, high WBC and the presence of FLT3-ITD mutations. Apart from the presence of SRSF2 mutations among CS-
Table 2. Multivariable analysis for complete remission, overall survival and disease free survival on the whole patient cohort.
All patients Characteristics
Age [years] ≥60
ECOG PS 2-3
WBC count [x109/L] ≥50
Induction arm ICE
AML category sAML
CS-AML
Complete remission HR (95% CI)
Overall survival HR (95% CI)
1.67 (1.25-2.23)
2.32 (1.55-3.47)
1.69 (1.23-2.3)
1.27 (0.97-1.66)
3.71 (2.69-5.12) 2.2 (1.48-3.25)
Disease-free survival
0.38 (0.21-0.7)
0.25 (0.11-0.57)
0.5 (0.24-1.03)
0.87 (0.48-1.57)
0.09 (0.05-0.19) 0.51 (0.2-1.37)
P
0.0017
0.0010
0.0582
0.6486
<0.0001 0.1608
P
0.0005
<0.0001
0.0010
0.0856
<0.0001 0.0001
HR (95% CI)
1.32 (0.95-1.83)
1.46 (0.87-2.43)
1.59 (1.14-2.21)
1.27 (0.95-1.7)
2.54 (1.76-3.67)
1.89 (1.27-2.81)
P
0.1030
0.1502
0.0063
0.1046
<0.0001 0.0018
WBC: white blood cell; ECOG PS: Eastern Cooperative Oncology Group Performance Status; sAML: secondary acute myeloid leukemia; ICE: idarubicin, cytarabine and etopo- side; HR: hazard ratio; CI: Confidence Interval; CS: chromatin-spliceosome; CS-AML: de novo AML carrying the CS mutations.
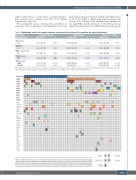
Figure 3. Mutational profile of acute myeloid leukemia patients carrying the chromatin-spliceosome mutation. Each column represents an individual acute myeloid leukemia patient carrying a chromatin-spliceosome mutation (CS-AML patient), while each row represents a single gene mutation out of the list at the left. Colored bars indicate the presence of one or more mutations of each gene. Variant types are specified according to the legend at the bottom of the figure.
haematologica | 2021; 106(10)
2583
