
Page 56 - 2021_10-Haematologica-web
P. 56
C. Caprioli et al.
AML patients (HR 0.16; 95% CI: 0.02-1.02; P=0.05), no other relevant clinical or biological factors (including the intensity of induction regimen) were identified for sAML and CS-AML patients (Online Supplementary Table S3).
Survival outcomes
The median follow-up for survival analysis was 4.9 years (range, 0.2-8.4). De novo AML patients showed a markedly better 5-years OS (61%) and DFS (54%) than CS-AML (OS 30%, DFS 26%; P<0.0001 and P=0.0009 respectively) and sAML (OS 17%, DFS 22%; P<0.0001 for both comparisons) (Figure 5A and B). Patients with sAML had a significantly worse OS as compared to CS- AML (P=0.02) (Figure 5A); however, possibly due to the high mortality rate of non-responding patients, no differ- ence was observed between the two categories when considering only patients achieving CR, who showed an overlapping 5-years DFS (26% and 22% respectively, P=0.32) (Figure 5B). A similar trend of OS according to the respective categories was confirmed on a smaller (n=50), independent single-center cohort (Online Supplementary Figure S2; for demographic and clinical characteristics of this cohort, see the Online Supplementary Table S6).
According to trial risk stratification criteria, consolida- tive alloHSCT in first CR was administered in 18 of 47 (38.3%) CS-AML, 31 of 59 (52.5%) sAML and 80 of 239 (33.5%) de novo AML patients, at a median age of 49.5, 52 and 44.5 years, respectively. By time-dependent analysis, the administration of alloHSCT in first CR carried a 5- years survival advantage in each AML category (CS-AML: 48% vs. 24%, P=0.07; sAML: 38% vs. 8%, P=0.0001; de
novo AML: 75% vs. 59%, P=0.01) (Figure 6A to C).
By multivariable analysis performed on the whole patients’ cohort accounting for age, performance status, WBC count at diagnosis and induction arm (standard vs. high-dose regimen), the markedly unfavorable prognosis of the sAML category was evident for each considered outcome (CR: HR 0.09, 95% CI: 0.05-0.19, P<0.0001; OS: HR 3.71, 95% CI: 2.69-5.12, P<0.0001; and DFS: HR 2.54, 95% CI: 1.76-3.67, P<0.0001). Although to a lesser degree, also the CS-AML category was independently associated to a negative prognosis, in terms of OS (HR 2.2, 95% CI: 1.48-3.25, P=0.0001) and DFS (HR 1.89, 95% CI: 1.27-2.81, P=0.0018), but not CR (Table 2). Other fac- tors affecting clinical outcomes included age ≥60 years, performance status (on CR and OS) and WBC ≥50x109/L
(on OS and DFS).
Since CS mutations frequently co-occurred within indi-
vidual patients, we sought to investigate whether specific variants of the signature might be independently responsi- ble for the adverse prognosis of CS-AML patients. In a multivariable analysis performed on the CS-AML cohort including CS-mutations and adjusting for the same vari- ables as in previous analysis (Online Supplementary Table S4), only RUNX1 and U2AF1 independently affected OS (HR 3.55, 95% CI: 1.28-9.87, P=0.01; and HR 6.87, 95% CI: 1.71-27.55, P=0.006) and DFS (HR 3.13, 95% CI: 1.1-8.95, P=0.03; and HR 16.46, 95% CI: 3.14-86.31, P=0.0009). Notwithstanding, even after subtracting RUNX1 and/or U2AF1-mutated patients from the first multivariable analy- sis (Online Supplementary Table S5), the CS-AML category maintained indipendently worse OS (HR 1.83, 95% CI: 1.07-3.14, P=0.0281) and DFS (HR 1.94, 95% CI: 1.15-3.26, P=0.0126) as compared to de novo AML.
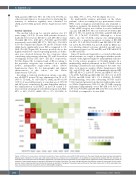
Figure 4. Patterns of co-occurrence and mutual exclusivity of gene mutations among 55 CS-AML patients. In the lower triangle are shown pairwise associations between gene mutations. For each pair, odds ratios indicate an in-creased (>1) or decreased (<1) probability of co-occurrence between the two mutations as assessed by the Fisher exact test for statistical significance. The odds ratio of the association is color coded and the significance level is indicated by the number of asterisks in each colored square as reported in the legend at the right of the figure. The upper triangle illustrates the absolute number of occurrences of each molec- ular pair, shown in green gradient and divided in intervals as reported in the legend. The analysis was performed on the whole study cohort (n=413), excluding muta- tions occurring in less than six patients and not defining AML categories.
2584
haematologica | 2021; 106(10)
