
Page 54 - 2021_10-Haematologica-web
P. 54
C. Caprioli et al.
these latter groups (P=0.14) when accounting for both first induction (performed in all patients) and intensified re-induction (performed in patients who did not respond after first cycle). By contrast, sAML patients did not improve their CR rate (59%) even after undergoing re- induction, as compared with both de novo AML (92.6%,
AB
P<0.0001) and CS-AML (85.5%, P=0.001). In addition, early death more frequently occurred in sAML patients (14 of 100, 14%) than in de novo AML (11 of 258, 4.3%; P=0.003) and CS-AML (three of 55, 5.5%; P=0.17). Globally, 41% of sAML patients, 14.5% of CS-AML patients and 7.3% of de novo AML patients did not
CD
EF
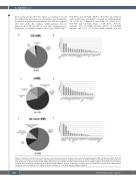
Figure 2. Cytogenetic and molecular characteristics of acute myeloid leukemia categories. For each acute myeloid leukemia (AML) category, pie charts depict the distribution of chromosomal abnormalities, while histograms show the frequency of individual mutations. (A and B) CS-AML (de novo AML carrying chromatin-spliceo- some mutations), (C and D) secondary AML (sAML) and (E and F) de novo AML. The label “other” includes: for the CS-AML category, abnormalities of chromosome 11 [(other than t(v;11q23.3) and del(11q)] and +8; for the sAML category, del(11q), +8, del(12p), t(5q;12p), t(1p;3q), t(3q;5q) and -Y; for the de novo AML category, +8, del(9q), +21, monosomy 21, +13, t(8q;11q), inv(3), monosomy X, -Y, del(16q), add(4q), add(6p), t(13p;17p).
2582
haematologica | 2021; 106(10)
