
Page 53 - 2021_10-Haematologica-web
P. 53
Clinical significance of chromatin-spliceosome AML
59 and 58 years respectively, P<0.0001) and presented at diagnosis with lower white blood cell counts (WBC) (P<0.0001), with no significant differences between the two latter categories. A lower BM blast infiltration was reported in sAML as compared with both de novo AML (P<0.0001) and CS-AML (P=0.02). By morphological analysis, multilineage dysplasia was described at diagno- sis in a minor proportion of CS-AML patients (11%), close to that of sAML patients (9%, P=0.77) and similarly higher than that of de novo AML patients (2%, P=0.0051).
The cytogenetic and molecular characteristics of the cohort are summarized in Figure 2 and the Online Supplementary Table S2.
In the CS-AML category (n=55) (Figure 2A and B), the majority of patients (87%) had a normal karyotype; 160 mutations were found in total, with a median of three mutations per patient (range, 1-6). The most frequently reported mutations of the CS signature were in KMT2A (KMT2A-PTD), RUNX1 and ASXL1 genes (respectively 45.5%, 44.4% and 22.2% of evaluable patients), while other mutations accounted for 5-17.5% of cases. While 54.5% of patients in this category presented with a single CS mutation, overlap and significant associations between CS mutations were observed in 45.5% of cases. Other mutations scored in CS-AML patients included IDH2, DNMT3A, FLT3-ITD, TET2 and NRAS (respective- ly 20%, 15.6%, 14.5% and 11% of evaluable patients), and others (Figures 3 and 4). We also included two patients with previously undescribed variants (UPN 633, STAG2 p.Met135Ile and UPN 753, SRSF2 p.Val18Leu) in the CS-AML category due to their predicted pathogenici- ty. One more patient harboring the RUNX1 p.Ala60V variant (UPN 3) was also included. This variant has been
found in familial platelet disorder associated to myeloid malignancy and is reported as such in the ClinVar data- base (https://www.ncbi.nlm.nih.gov/clinvar/variation/V CV000463986).
Among the 100 sAML patients (Figure 2C and D), a huge proportion carried a complex karyotype (58%) and abnormalities of chromosome 7 (12%) or 5 (5%). Nevertheless, 13% of patients in this category had a nor- mal karyotype; 62 mutations were reported in total (median 0, range 0-8), mostly involving CS genes.
The de novo AML category (n=258) (Figure 2E and F) included 25% of patients with a core binding factor AML, a high prevalence (65%) of patients with normal kary- otype and 10% of patients with other non WHO-recur- rent cytogenetic abnormalities. A total of 607 mutations were scored (median two per patient, range 0-15), the most frequently represented being NPM1 (60.7% of patients), DNMT3A (49.3%) and FLT3-ITD (27.5%).
Outcomes after intensive induction
Patients with de novo AML, sAML and CS-AML were equally distributed among the randomly assigned induc- tion regimen (conventional ICE or high-dose sHD) and showed a comparable performance status (Table 1).
After the first induction cycle, a lower proportion of sAML patients achieved CR (51 of 100, 51%) as com- pared to both de novo AML (228 of 258, 88.4%; P<0.0001) and CS-AML (43 of 55, 78.2%; P=0.002). However, also CS-AML showed a trend toward an inferior CR rate as compared to de novo AML (P=0.07), although this did not reach statistical significance, eventually due to the rela- tive small number of patients in this group. Interestingly, no significantly worse CR rate was observed between
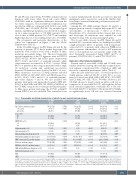
Table 1. Demographic and clinical characteristics of patients by acute myeloid leukemia category.
Clinical characteristics
Age [years], median (range) <60, n(%)
≥60, n(%)
Sex, n (%) M
F
ECOG PS, n (%) 0-1
2-3
Hepatomegaly, n (%)
Splenomegaly, n (%)
Extramedullary involvement, n (%) Hemoglobin [g/dL], median (range) WBC count [x109/L], median (range) Platelets, median (range)
BM blast cells (%), median (range) AML with multilineage dysplasia, n (%) Induction treatment, n (%)
ICE
sHD
CS-AML N=55
58 (20-72) 33 (60) 22 (40)
25 (45.5) 30 (54.5)
49 (89.1) 6 (10.9)
5 (9.1)
2 (3.6)
6 (10.9) 9.3 (5.1-13.8) 8.1 (1.1-252) 77 (12-815) 80 (8-100) 6 (10.9)
25 (45.5) 30 (54.5)
P* 0.5542
0.4015 0.0349
0.5674
0.5216 0.2150 0.5458 0.6334 0.1794 0.1441 0.0227 0.7786 0.7613
sAML N=100
59 (22-72) 53 (53) 47 (47)
63 (63) 37 (37)
92 (92) 8 (8)
6 (6)
10 (10)
7 (7)
8.8 (4.3-13.7) 4.8 (0.8-237) 57 (2-338) 64 (2-100) 9 (9)
48 (48) 52 (52)
P** <0.0001
<0.0001 0.0076
0.4207
0.4916 0.3159 0.0267 0.1905 <0.0001 0.3649 <0.0001 0.0041 0.6852
de novo AML N=258
48 (16-73) 207 (80.2) 51 (19.8)
122 (47.3) 136 (52.7)
230 (89.1) 28 (10.9)
21 (8.1) 36 (14)
41 (15.9) 9.3 (3-15.8) 22.3 (0.5-282) 52 (5-852) 80 (0-100) 5 (1.9)
130 (50.4) 128 (49.6)
P*** 0.0001
0.0013 0.8048
0.9903
0.7897 0.0334 0.3477 0.7040 0.0004 0.0151 0.2067 0.0051 0.5065
CS-AML: chromatin-spliceosome acute myeloid leukemia; sAML: secondary acute myeloid leukemia; de novo AML: de novo acute myeloid leukemia; ECOG PS: Eastern Cooperative Oncology Group Performance Status; WBC: white blood cell count; BM: bone marrow; ICE: idarubicin, cytarabine and etoposide; sHD: sequential high-dose chemotherapy cytarabine and idarubicin. P-values refer to: *CS-AML vs. sAML; **sAML vs. de novo AML; *** de novo AML vs. CS-AML. Hepatomegaly was defined as lower liver edge >2 cm from costal margin. Splenomegaly was defined as spleen >1 cm from costal margin, confirmed by ultrasound scan with longitudinal axis >12 cm. Extramedullary AML was defined as AML presenting with central nervous system involvement or mass lesions.
haematologica | 2021; 106(10)
2581
