
Page 202 - 2021_10-Haematologica-web
P. 202
A. D'Alessandro et al.
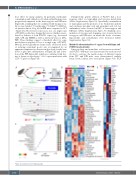
dose effect for many analytes. In particular, methionine consumption and utilization of S-adenosylmethionine were progressively impaired in the heterozygous and KO mice (Figure 2E), a finding that we confirmed with tracing of sta- ble isotope labeled 13C-methionine (13C-SAM/13C-SAH lev- els increase almost 3-log fold in KO mice compared to WT - Figure 2G). However, in some cases, loss of a single copy of PCMT1 resulted in a change that was not further exacer- bated by deletion of both PCMT1 copies (e.g., decreased GSH, G3P, and 5OXO as well as increased Glucose, DPG, PEP). These findings suggest a threshold effect for some metabolites in response to loss of a single copy of PCMT1. Overall, altered glutathione homeostasis (decreased levels of reducing equivalent pools) was accompanied by an apparent compensatory decrease in glycolysis (steady state levels of glycolytic intermediates in Figure 2E) and activa- tion of the PPP (Figure 2E), which we confirmed with trac- ing of lactate isotopologues27 +2/+3 upon incubation with 1,2,3-13C3-glucose (Figure 2F).
Unexpectedly, genetic ablation of PCMT1 had a dose response effect on tryptophan and tyrosine metabolism (Online Supplementary Figure S1). Specifically, accumulation of tryptophan and the products of its breakdown (indole) and oxidation (picolinic acid and quinolinic acid, but not anthranilate) were observed in RBC of heterozygous and KO mice (Online Supplementary Figure S1). Similarly, accu- mulation of tyrosine and dopamine was observed in het- erozygous and KO mice, in which the levels of taurine, hypotaurine and acetylcholine were decreased (Online Supplementary Figure S1).
Metabolic characterization of organs from wild-type and PCMT1 knockout mice
Since picolinic and quinolinic acid are neurotoxicants28 and PCMT1 KO mice are characterized by early mortal- ity due to seizures, the metabolomes of different organs from WT and KO mice were characterized, namely brain, heart, kidney, liver and spleen (Figure 3A). PCA
ADE
B
C
Figure 2. Continued on the following page.
2730
haematologica | 2021; 106(10)
