
Page 200 - 2021_10-Haematologica-web
P. 200
A. D'Alessandro et al.
Software, Inc, La Jolla, CA) and MetaboAnalyst 4.0, which allows to calculate false discovery rate (FDR)-corrected P-values from t- test and ANOVA analyses.25 Heat maps include color are graphed as Z-score normalized values for each metabolite/protein (ranges included as legends within each panel containing a heat map); each single box in the heat maps indicates a distinct biological replicate per each group. All the raw data from the omics analyses reported in this study are included in the Online Supplementary Table S1.
Results
Lack of a single copy of PCMT1 results in significant alterations in the metabolome and proteome of red blood cells compared to wild type red blood cells
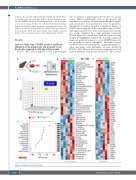
1A). As predicted, phenotypes between the two mouse strains differed significantly both at the protein and metabolite level (Figure 1B and C report the top 50 signifi- cant metabolites and proteins by t-test, respectively). Unsupervised analyses revealed a significant impact of PCMT1 heterozygosity on the omics phenotypes of RBC, with approximately 33% of the total variance between the two groups explained by a single principal component (PC1 in Figure 1D). Metabolites with the highest loading weights are highlighted in Figure 1E, showing a significant impact on pathways relevant to redox/NADPH homeosta- sis (glutathione, ribose phosphate, biliverdin, formyl- tetrahydrofolate, cysteinyl-glycine, gamma-glutamyl-cys- teine) and amino acids (glutamate, tyrosine, glycine) in PCMT1+/- RBC. Of note, lower levels of enzymes involved in these pathways were detected in PCMT1+/- RBC, includ-
PCMT1+/- RBC were compared to WT controls (Figure ABC
D
E
Figure 1. Continued on the following page.
2728
haematologica | 2021; 106(10)
