
Page 99 - 2021_09-Haematologica-web
P. 99
T cells affect the prognosis of myelofibrosis
A i
ii
EB i
ii
C
iii
iii
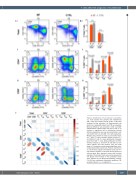
Figure 2. Distribution of T-cell subsets in myelofibro- sis. T-cell subsets from patients with myelofibrosis (MF; n=41) and healthy controls (CTRL; n=28) were analyzed by flow cytometry. (A) Representative dot plots from a single MF patient and CTRL are depicted. Minimal difference was observed in CD4+ and CD8+ differentiation subsets within the total T cells (i). In contrast, a significant shift in distribution towards effector populations was seen among activation sub- sets within CD4+ (ii) and CD8+ (iii) T-cell populations. Whereas the numbers of naïve (TN) and central mem- ory T cells (TCM) were reduced, effector memory (TEM) and effector T cells (TEFF) were significantly increased, apart from CD8+ TEM cells. (B) Quantification of differ- entiation subsets (i), and CD4+ (ii) and CD8+ (iii) acti- vation subsets from MF patients (red) and CTRL (gray). (C) Correlation matrix showing significant color- coded relationships (lower half), Pearson coefficients (r), and P-values (upper half) between each pair of T- cell subsets. Numbers in dot plots denote percent of cells per gate. Bars represent means with standard deviation. The Student t-test was used to compare the two groups. The P-values in the correlation matrix were adjusted by the Benjamini-Hochberg method. P<0.05 was considered statistically significant. PB, peripheral blood; n.s., not significant.
haematologica | 2021; 106(9)
2387
