
Page 97 - 2021_09-Haematologica-web
P. 97
T cells affect the prognosis of myelofibrosis
cell exhaustion.16 Programmed cell death protein 1 (PD1) is an essential T-cell checkpoint receptor that is overex- pressed as T cells undergo persistent activation, thus pro- viding a pathway to control T-cell response.17 In several neoplasms, PD1 was found to play a critical role in regu- lating T-cell function.18 Recent studies showed that myeloid cells from subjects with myeloproliferative neo- plasms express high levels of PD1 ligand 1 (PDL1),19,20 and that the overexpression of PDL1 is induced by constitu- tively activated JAK2.19 Elevated levels of PDL1 on tumor cells frequently correlate with increased JAK2 activity,21 and high PDL1 expression confers sensitivity to anti-PD1 therapy.22 Conversely, decreased PDL1 levels were detect- ed in rare solid tumors harboring loss-of-function JAK2 mutations, and have been associated with poor outcomes of PD1/PDL1 blockade therapy.23
Because JAK2 is constitutively activated in MF, we sought to determine whether the T-cell activation status is altered in MF patients and whether and how it is affected by JAK inhibitor therapy. We also sought to elucidate the relationship between T-cell activation and exhaustion given the implications of this association in treating MF patients, developing immune-harnessing MF strategies, and rationally guiding clinical trials. To achieve these goals, we systematically analyzed the activation status of periph- eral T-cell subsets of patients with MF at baseline and over the course of treatment with ruxolitinib. Furthermore, we tested the association of PD1-co-expressing helper (CD4+) and cytotoxic (CD8+) T-cell subpopulations with disease progression and assessed the effect of PD1+ T-cell fractions on the clinical outcome of MF patients.
Methods
Specimen assessed in this study
We obtained corresponding BM and peripheral blood (PB) specimens from 47 patients with MF who were enrolled in a phase I/II clinical trial of ruxolitinib at the University of Texas MD Anderson Cancer Center (MDACC) (ClinicalTrials.gov identifier, NCT00509899) between June 2007 and April 2015.24 Specimens were collected prior to treatment and for up to 7 years after treatment, once Institutional Review Board (IRB)- approved informed consent had been obtained. The patients were diagnosed with primary MF, post-essential thrombo- cythemia MF or post-polycythemia vera MF; the diagnoses were established in accordance with the 2008 World Health Organization classification.25 The patients did not receive anti- neoplastic medications for at least 14 days before starting treat- ment. Ruxolitinib was administered orally (10-25 mg twice a day or 50-200 mg once a day) according to the clinical trial pro- tocol, which was designed to assess the efficacy and safety of ruxolitinib. For control studies, PB specimens were obtained from 28 healthy individuals (13 males and 15 females) age- matched with MF patients. The clinical and laboratory research was conducted in accordance with the Declaration of Helsinki and approved by the MDACC IRB1 committee (protocol identi- ties LAB01-473 and LAB05-0321).
Cell fractionation and immunostaining
To detect and quantify cell surface proteins, we performed multiparameter flow cytometry analyses of low-density cells that were previously stored in dimethylsulfoxide. Briefly, BM and PB specimens were collected into Vacutainer tubes contain-
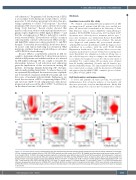
A B C D
H G F E
Figure 1. T-cell subset gating strategy. Representative dot plots demonstrating the flow cytometry gating strategy that was used to analyze individual T-cell subsets. (A) First, leukocytes were isolated based on CD45 (PE-CF594) positivity and side scatter area (SSC-A). (B) Singlets were then gated using forward scatter area (FSC- A) and height (FSC-H). (C) Within the singlet leukocyte population, lymphocytes were defined based on FSC-A and SSC-A parameters. (D) Subsequently, T cells were separated from B cells and natural killer (NK) cells based on positivity for CD3 (APC) and HLA-DR (PerCP-Cy5.5). (E) Gamma delta (γ/δ) T cells were excluded from further analysis using T-cell receptor gamma delta (TCRγ/δ; PE-Cy7) and SSC-A. (F) Alpha beta (α/β) T cells were further gated to differentiate between CD4+ and CD8+ T cells based on CD4 (V500) and CD8 (APC-H7). (G) Naïve (TN), central memory (TCM), effector memory (TEM) and effector T cells (TEFF) of CD4/CD8 subsets were obtained using quadrant gates based on CD45RO (FITC) and CD62L (BV421). (H) Cells positive for programmed cell death 1 (PD1) were obtained using density plots for PD1 (PE) with the corresponding isotype control as reference. Red dots depict T cells within each of the previously defined gates; only the CD4+ subset is displayed in (G) and (H).
haematologica | 2021; 106(9)
2385
