
Page 101 - 2021_09-Haematologica-web
P. 101
ii ii
iii iii
C
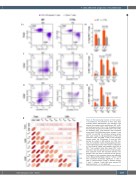
Figure 4. PD1-expressing fractions of T-cell subsets in myelofibrosis. The fractions of PD1+ cells were assessed within differentiation and activation T-cell subsets from patients with myelofibrosis (MF; n=41) and healthy controls (CTRL; n=28). (A) Representative flow cytometry dot plots from a MF patient and a CTRL are depicted. PD1+ T-cell fractions were increased across both CD4/CD8 differentiation subsets (i) and all CD4+ (ii) and CD8+ (iii) activation subsets, except CD4+ naïve T cells (TN). (B) Quantification of PD1+ cell fractions in CD4+ and CD8+ T cells (i) and activation subsets within the CD4-derived (ii) and the CD8- derived (iii) subsets in MF patients and CTRL sub- jects. (C) Correlation matrix showing significant color- coded relationships (lower half), Pearson coefficients (r), and P-values (upper half) between each pair of PD1+ T-cell subsets. Violet dots depict PD1+ cells; numbers in dot plots denote percent of cells per gate. Bars represent means with standard deviation. The Student t-test was used to compare the two groups. The P-values in the correlation matrix were adjusted by the Benjamini-Hochberg method. P values <0.05 were considered statistically significant. TN: naïve T cells; TCM: central memory T cells; TEM: effector memory T cells; TEFF: effector T cells; BM: bone marrow; PB, peripheral blood; n.s.: not significant.
T cells affect the prognosis of myelofibrosis
Ai Bi
haematologica | 2021; 106(9)
2389
