
Page 100 - 2021_09-Haematologica-web
P. 100
I. Veletic et al.
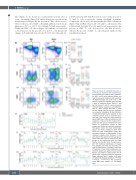
time (Figure 3). As shown in a representative patient after 2 years of treatment (Figure 3Ai) and in all patients over the mean treatment period (Figure Bi), the percent of CD4+ cells decreased, whereas the percent of CD8+ cells significantly increased (mean differences -5.1% vs. 13.9%, P=0.042 and P=0.025, respectively). Within the CD4+ cell subsets (Figure 3Aii and Bii), we observed a 2-fold increase in the percent of TN and TCM cells (mean fold changes 2.05 and 2.26, respectively; P<0.001 for both), and 1.2-
Ai Bi
ii ii
iii iii
Ci
ii
iii
fold (P=0.01) and 1.48-fold (P<0.001) decreases in the percent of TEM and TEFF cells, respectively, during ruxolitinib treatment. Comparable effects were observed within the CD8+ cell subsets (Figure 3Aiii and Biii): the percent of TN and TCM cells increased by 2.22-fold and 1.64-fold (P=0.002 and P=0.03, respectively), the percent of CD8+ TEFF cells decreased by 1.21-fold (P=0.001), whereas the percent of CD8+ TEM cells remained unaffected by ruxolitinib treatment.
Figure 3. Effects of ruxolitinib treatment on T-cell subsets of patients with myelofibrosis. T-cell subsets from patients with myelofibro- sis (MF) (n=25) were analyzed before and over the course of treatment with ruxolitinib. (A) Representative dot plots from a MF patient at treatment baseline (Bsl) and after 2 years of treatment (Ruxo). Naïve (TN) and central memory T cells (TCM) were increased, whereas effector memory (TEM) and effector T cells (TEFF) were reduced. Only CD4+ TEM cells did not change significantly with treatment as compared to baseline. (B) Quantification of CD4/CD8 differentiation subsets (i) and activation subsets (ii-iii) at treatment base- line (red) and during the overall follow-up period (light blue). Follow-up values were cal- culated as a mean of all the analyzed time- points over the course of treatment for each patient. (C) Longitudinal analysis of T-cell subsets over 6 years of ruxolitinib treatment. The figures shows the mean percentages (green) and linear predictions (dark blue) based on linear mixed-effects model with repeated measures in differentiation (i) and activation subsets (ii-iii). Numbers in dot plots denote the percent of cells per gate. A paired t-test was used to compare the two groups. In the longitudinal plots error bars denote the standard error, P-values repre- sent the statistical significance of change from baseline over time, and asterisks indi- cate the significance of change in each year of treatment. Linear mixed models were cor- rected for spleen size, grade of bone marrow fibrosis, and JAK2V617F allele burden. The P- values were computed using the Kenward- Roger adjusted F-test. P values <0.05 were considered statistically significant. *P<0.05; **P<0.01; ***P<0.001. PB: peripheral blood; BM: bone marrow; n.s.: not signifi- cant.
2388
haematologica | 2021; 106(9)
