
Page 79 - 2021_06-Haematologica-web
P. 79
Hyaluronan/CD44-mediated VLA-4 activation in AML
and six different AML patients’ samples independently of their FLT3 mutation status (FLT3 wild-type [n=3], FLT3-ITD [n=3]) (Figure 4Bii + Cii).
Additional experiments, using the MEK inhibitor cobime- tinib and the PI3Kδ inhibitor idelalisib, further suggested
that PI3K, but not MAPK pathways are involved in CD44- triggered inside-out CD49d cluster formation (Online Supplementary Figure S6B). We next confirmed that PP2, midostaurin and idelalisib treatment not only inhibited cluster formation, but also reduced the binding of primary
Aiii
Biii
Di Dii
Ai
Bi
Ci
Ei
Aii
Cii
Bii
Eii
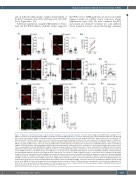
Figure 3. Hyaluronic acid treatment induces CD49d cluster formation on acute myeloid leukemia cells. (A) Confocal images and CD49d cluster analysis of OCI- AML3 (i) or primary acute myeloid leukemia (AML) cells from bone marrow (BM) aspirates (ii). Cells were untreated (UTC) or pretreated with hyaluronic acid (HA) and then settled on immobilized VCAM-1, followed by fixation and staining with αCD49d (red) monoclonal antibody (AHP1225), where indicated (1 representative of 6 different patients is shown). CD49d clusters for each treatment were quantified using ImageJ software (n=50 cells, unpaired t-test). Mean numbers of CD49d clus- ters per cell were compared from six different patients’ samples with/without HA treatment (iii, paired t-test). (B) Confocal images and CD49d cluster analysis of OCI- AML3 (i) and primary AML cells (ii). Cells were pretreated with/without αCD44 antibody (clone 515) before treatment or not with HA and then settled on immobilized VCAM-1, followed by fixation and staining with αCD49d (red) monoclonal antibody. CD49d clusters were quantified for each treatment using ImageJ software (n=50 cells, one-way analysis of variance [ANOVA] with multiple comparisons). Mean numbers of CD49d clusters per cell were compared from six different patients’ samples with/without HA treatment and with/without αCD44 treatment (iii, one-way ANOVA with multiple comparisons). (C) Confocal images and CD49d cluster analysis of control shRNA (shCont) (i) or shCD44-transduced OCI-AML3 (ii). Cells were pretreated with/without HA and then settled on immobilized VCAM-1, followed by fixation and staining with αCD49d (red) monoclonal antibody, where indicated (1 of 2 replicates is shown). CD49d clusters for each treatment were quantified using ImageJ software (n=50 cells, unpaired t-test). (D) OCI-AML3 (i) or primary cells (ii) were perfused over an αCD49d (clone HP2/1) substrate for 1 min at 0.5 dyn/cm2 with/with- out HA pretreatment. Categories of interaction (tethers) are expressed as frequencies of cells in direct contact with the substrate (6 replicates were performed with OCI-AML3, 3 replicates were performed with a sample from 1 AML patient). (E) Primary CD34+ cells from four different patients (3 with non-Hodgkin-lymphoma and 1 with multiple myeloma) were pretreated with/without HA and then settled on immobilized VCAM-1, followed by fixation and staining with αCD49d (red) and αCD34 (green, clone QBEND-10) monoclonal antibodies (1 representative patient’s sample is shown). CD49d clusters were quantified for each treatment using ImageJ soft- ware (n=50 cells, unpaired t-test). (ii) Mean numbers of CD49d clusters per cell were compared from four different patients’ samples with/without HA treatment (paired t-test). Bars, 5 mm. *P<0.05; **P<0.01; ***P<0.001; ****P<0.0001.
haematologica | 2021; 106(8)
2107
