
Page 53 - 2021_06-Haematologica-web
P. 53
Redefinition of HBZ localization in ATL
not shuttle between the cytoplasm and nucleus.27 Since in acute and chronic ATL, HBZ could be localized in both compartments, with a clear preference for the cytoplasm, it was important to assess whether the entire pool of cyto- plasmic HBZ could indeed shuttle between cytoplasm and nucleus. Cells were treated with LMB and analyzed by immunofluorescence and confocal microscopy. Results presented in Figure 5A show that this was not the case because LMB treatment did not result in the accumulation of HBZ protein in the nucleus in either acute (PH140126) or chronic (PH170918) ATL cells (Figure 5A).
As a control, LMB treatment of normal PHA-treated PBMC was instead capable to significantly retain the p65/RelA component of the NF-kB complex in the nucleus (Figure 5B). Taken together, these results strongly suggest that the cytoplasmic component of HBZ protein in both acute and chronic ATL does not ostensibly shuttle between the cytoplasm and nucleus through CRM1/exportin regu- lated mechanism.
Calreticulin may regulate Tax-1 nuclear export by inter- acting with, and retaining the viral protein in the cyto- plasm in a concentration dependent fashion.40 In order to verify whether calreticulin might contribute to the cyto- plasmic localization of HBZ, we costained PBMC from both acute and chronic patients with HBZ and calreticulin specific antibodies. Cytoplasmic HBZ did not colocalize with calreticulin. Moreover, we could not detect a signifi- cant increased expression of calreticulin in HBZ-positive cells, compared to HBZ-negative cells (Online Supplementary Figure S4A). Cytoplasmic Tax-1 instead par-
A
tially colocalized with calreticulin in acute ATL patient PH160822, although also in this case we could not observe a clear different level of calreticulin expression in Tax-1 positive cells compared to Tax-1-negative cells (Online Supplementary Figure S4B)
The cytoplasmic localization of HBZ in adult T-cell leukemia-lymphoma patients may partially affect p65/RelA but not JunD subcellular distribution
Previous studies have shown that HBZ inhibits Tax-1- mediated NF-kB activation and consequent transcription of various NF-kB target genes by targeting p65/RelA sug- gesting that this can contribute to the attenuation of viral replication and persistence of infection.41,42 Here we ana- lyzed the subcellular localization of p65/RelA in PBMC isolated from both acute and chronic ATL subjects. Interestingly, we found p65/RelA in the cytoplasm of HBZ-positive cells of both acute and chronic patients, par- tially colocalizing with HBZ (Online Supplementary Figure S5A, PH160822 and PH170706, respectively). This sug- gests that a possible, although limited, HBZ-p65/RelA cytoplasmic interaction may limit p65/RelA transition into the nucleus and the activation of the NF-kB target genes.
In order to evaluate the impact of the observed cytoplas- mic localization of HBZ on other cellular pathways target- ed by the viral protein, we analyzed the subcellular distri- bution of the transcription factor JunD, previously shown to weakly interact and partially colocalize with HBZ in an ATL patient expressing HBZ in the nucleus.29 When HBZ was expressed in the cytoplasm, JunD was still localized
B
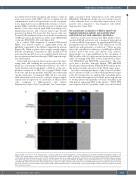
Figure 4. HBZ expression in T-cell subpopulations of chronic adult T-cell leukemia-lymphoma. Confocal microscopy analysis of peripheral blood mononuclear cells (PBMC) from representative chronic (CH) leukemic PH170918. (A) Upper panels: PBMC of patient CH PH170918 were costained with the 4D4-F3 anti-HBZ mono- clonal anitbody (mAb) followed by Alexa Fluor 546-conjugated goat anti-mouse IgG1 antibody (red) and with the anti-CD4 rabbit mAb (RabmAb) followed by Alexa Fluor 488-conjugated goat-anti-rabbit IgG antibody (green). Nucleus was stained with DRAQ5. (B) PBMC of CH patient PH170918 were costained with the 4D4-F3 anti-HBZ mAb followed by Alexa Fluor 546-conjugated goat anti-mouse IgG1 antibody (red) and with the anti-CD8 RabmAb directly conjugated to Alexa Fluor 647 (blue). At least 200 cells were analyzed; DIC represents the differential interference contrast image. representative images derived from each sample are shown. All scale bars are 5mm.
haematologica | 2021; 106(8)
2081
