
Page 51 - 2021_06-Haematologica-web
P. 51
Redefinition of HBZ localization in ATL
distinction in patient PH171206 where only 20% of the cells were CD3-positive (Online Supplementary Figure S2). Moreover, the CD4 T-cell marker identifying the T-helper subpopulation of CD3-positive T cells, although strongly expressed, was not present in the entire population (e.g., see patients PH170706 and PH150610). Here, at variance with acute ATL, the observed phenotype was more simi- lar to the CD4 phenotype observed in healthy donors PBMC. In chronic ATL patients the CD8 marker was expressed in a variable proportion of PBMC (Online Supplementary Figure S2), again mirroring the CD8 pheno- type of normal PBMC more than the phenotype of acute ATL. The CD25 T-cell activation marker was not expressed, while HLA-DR was variably expressed, but always in a minor proportion of cells again mimicking the phenotype of normal PBMC.
Expression and subcellular localization of HBZ were then analyzed. As for acute ATL cases, HBZ was expressed in all cases ranging from 9.7% in patient PH171206 to 12.0%, 38.0% and 97.5% in patients PH170706, 150610 and PH170918, respectively (Online Supplementary Table S1), demonstrating that the variability in the percentage of HBZ-positive cells was similar in chronic and acute ATL.
A
Thus, at least in the small number of cases analyzed, expression of HBZ may be not correlated with the clinical stage of the disease. Importantly, as observed in acute ATL, in all four chronic ATL cases HBZ was localized mostly in the cytoplasm (Figure 3A), with no cells expressing HBZ exclusively in the nucleus (Online Supplementary Table S1). Cells expressing nuclear HBZ were a minority as compared to the cells expressing HBZ only in the cytoplasm (29% vs. 68% in PH170918, and 2.1% vs. 7.5% in PH171206). Moreover, PBMC of two chronic ATL patients, PH150610 and PH170706, did not show detectable nuclear HBZ expression at all (Figure 3A; Online Supplementary Table S1). HBZ appeared as distinctive dots, smaller in the nucleus when present as compared to the cytoplasm (Figure 3A, PH170918 and PH171206) where the dots were often con- fluent creating a sort of ring around the nucleus (Figure 3A, PH170706 and PH150610).
Interestingly Tax-1 was found expressed only in two of four chronic ATL patients, namely, PH170706 and PH171206, with a relative percentage of 6.4% and 1.0%, respectively (Online Supplementary Table S1). Tax-1-positve cells of patients PH170706 expressed the viral marker only in the cytoplasm (Figure 3B; Online Supplementary Table S1)
B
C
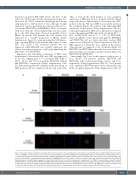
Figure 2. Tax-1 subcellular localization in peripheral blood mononuclear cells of patients with acute adult T-cell leukemia-lymphoma. (A) Peripheral blood mononu- clear cells (PBMC) of representative acute adult T-cell leukemia-lymphoma patients PH40126 (A) and PH1612N07 (B) were stained with the A51-2 anti-Tax-1 mon- oclonal antibody (mAb) followed by Alexa Fluor 488-conjugated goat-anti-mouse IgG2a antibody (green) and analyzed by confocal microscopy. Counterstaining of the nuclear or cytoplasmic compartments was performed by using DRAQ5 fluorescence probe to detect the nucleus (blue) and anti-vimentin rabbit polyclonal antibody followed by goat anti-rabbit IgG conjugated to Alexa Fluor 546 (B, red) to stain the cytoplasmic compartment. (C) PBMC of representative acute ATL patient PH160822 were costained with the 4D4-F3 anti-HBZ mAb followed by Alexa Fluor 546-conjugated goat anti-mouse IgG1 antibody (red) and with the A51-2 anti-Tax- 1 mAb followed by Alexa Fluor 488-conjugated goat-anti-mouse IgG2a antibody (green) and analyzed by confocal microscopy. DRAQ5 fluorescence probe was used to detect the nucleus (blue). DIC represents the differential interference contrast image. At least 300 cells were analyzed. All scale bars are 5mm.
haematologica | 2021; 106(8)
2079
