
Page 51 - 2021_07-Haematologica-web
P. 51
Synergistic targeting of WEE1 and GLS1 in T-ALL
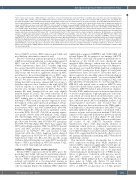
Figure 3 (from previous page). WEE1 inhibition compromises T-cell acute lymphoblastic leukemia (T-ALL) cell viability and aerobic glycolysis. (A) Cell viability analy- sis in multiple T-ALL cell lines subjected to MK1775 treatment at various concentrations (50, 100, 200, 400, 800 and 1600 nM) for 24 hours (h). Cell viability was determined using the CCK8 Cell Proliferation Assay Kit. Percentages of viable cells are shown relative to the untreated control. (B) CCRF-CEM and KOPTK1 cells were infected with lentiviruses expressing control (shCtrl) or WEE1 (sh#1 or sh#2). Live cells were counted at the indicated time points and cell growth was plotted as shown. (C) HPB-ALL cells were treated with MK1775, or infected with lentiviruses expressing WEE1 shRNA (sh#1 or sh#2) as indicated. Phosphorylated CDK1 (p- CDK1), WEE1 and MYC protein levels were analyzed by immunoblots. As a WEE1 substrate, CDK1 phosphorylation was used to reflect WEE1 activity. ACTIN serves as a loading control. (D) Heatmap of down-regulated metabolites in MK1775 (200 nM)-treated HPB-ALL cells. Intracellular metabolites were prepared and analyzed by gas chromatography time-of-flight mass spectrometer (n=5). Identification of significantly different metabolites between experimental groups were determined by variable importance in projection (VIP) values (VIP > 1) and Student t-test (P<0.05). Colors indicate relative metabolite abundance. (E) Metabolite set enrichment analysis of significantly down-regulated metabolites (P<0.01) in MK1775-treated HPB-ALL cells. (F) CUTLL1 cells were treated with MK1775 (200 nM) or GSI Compound E (1 mM) for 24 h. Glucose consumption and lactate secretion were analyzed and normalized to the same live cell number. (G) HPB-ALL cells were treated with MK1775 for 24 h as indicated. Six representative genes involved in glycolysis pathway were analyzed by real-time quantitative polymerase chain reaction (RT- qPCR) (left). (Right) Immunoblots of indicated proteins. (H) Primary cells from a T-ALL patient were injected into NPG mice which underwent control (Ctrl) or MK1775 (20 mg/kg) treatments as described in the Methods section. Human CD45+ cells from the spleens of control or MK1775-treated mice were purified for RT-qPCR and immnoblotting to assess glycolytic gene expression. Data shown represent the means (± standard deviation) of biological triplicates. *P<0.05, **P<0.01. Editor's note. This figure is slightly different from the one pre-published as early view because the authors noticed an error in panel C and asked to replace it with the one shown above.
but not N-MYC, activates WEE1 expression in T-ALL, and most likely in other tumor contexts as well.
Previous chromatin immunoprecipitation sequencing (ChIP)-Seq analysis manifested a strong binding signal of MYC, but not TAL1 or GATA3, in the WEE1 locus (Online Supplementary Figure S2F),35,36 further supporting the concept that MYC directly activates WEE1 transcrip- tion. To validate these data, we performed conventional ChIP assays and revealed a significant increase in MYC recruitment to the potential binding site on WEE1, simi- lar to a well-characterized MYC target NCL (Figure 2C and D). We next constructed the WEE1 promoter con- taining the MYC responsive element (RE, E-box) into a luciferase reporter vector. Similar to the triple MYC RE (3 E-box) reporter as a positive control, the WT WEE1 reporter was strongly activated by MYC whereas the mutant RE with disrupted E-box was only slightly induced (Figure 2C and E). The weak activation on the mutant RE was probably due to additional unrevealed MYC binding sites or other transcription factors con- tributing to WEE1 luciferase reporter expression. In fur- ther support of this, gene expression profiling of 117 pri- mary T-ALL30 revealed a strong and significant correla- tion between WEE1 and MYC mRNA levels (R=0.335, P<0.001) (Figure 2F). MYC showed a significant correla- tion with WEE1 (R=0.187, P=0.002) in another expres- sion profile dataset with 264 primary T-ALL (Figure 2G).32 Interestingly, MYC was more strongly and signifi- cantly correlated with WEE1 in NOTCH1 mutant sam- ples (R=0.224, P=0.001) than NOTCH1 WT specimens (R=0.038, P=0.754) (Figure 2H). These data suggest that MYC preferentially regulates WEE1 in NOTCH1 mutant cases, and MYC probably activates differential gene expression in NOTCH1 WT and mutant T-ALL. Consistent with this, MYC depletion barely changed WEE1 expression in NOTCH1 WT SUP-T1 cells (Online Supplementary Figure S3). Our data thus provide strong evidence demonstrating that oncogenic MYC specifically binds to WEE1, particularly in NOTCH1 mutant T-ALL cells, for direct transcriptional activation.
Inhibition of WEE1 impairs aerobic glycolysis
Elevated WEE1 expression driven by MYC poses the possibility that T-ALL cells may be particularly depend- ent on WEE1 for cell proliferation and survival. Indeed, a selective WEE1 inhibitor MK1775 as a single agent reduced cell viability in a dose-dependent manner in seven T-ALL cell lines, whereas the effect on normal BM cells was minimal (Figure 3A). Similarly, WEE1 depletion
significantly suppressed KOPTK1 and CCRF-CEM cell growth (Figure 3B). In support of our findings, MK1775 was shown to elicit ALL cell apoptosis primarily due to disruption of the G2-M cell cycle checkpoint and increased DNA damage,13 which were also detected in CUTLL1 cells (Online Supplementary Figure S4). Of partic- ular interest, we found that WEE1 depletion or inhibition reduced MYC steady-state levels (Figure 3C and Online Supplementary Figure S5A and B). Given that MYC is a master regulator in controlling cancer cell metabolism in the majority of tumor contexts,37 we reasoned that WEE1 inhibition would lead to metabolic change in T-ALL cells through MYC downregulation. To test this hypothesis, HPB-ALL cells treated with or without MK1775 were subjected to metabolomic analysis. Relative to the mock treatment, MK1775 induced global metabolic changes. Notably, WEE1 inhibition caused a decreased production of fructose-6-phosphate, 3-phosphoglycerate and lactic acid, which are crucial metabolic intermediates or prod- ucts involved in aerobic glycolysis (Figure 3D). We fur- ther conducted metabolite set enrichment analysis of all down-regulated molecules and revealed that the Warburg effect was the top hit affected by WEE1 inhibi- tion (Figure 3E). Consistent with these data, MK1775 sig- nificantly inhibited glucose uptake concomitant with a decrease in lactic acid secretion in multiple T-ALL cells, similar to GSI compound E which was previously shown to repress glycolysis in T-ALL (Figure 3F and Online Supplementary Figure S5C).18 WEE1 depletion yielded sim- ilar results to the MK1775 treatment (Online Supplementary Figure S5D). Importantly, addition of membrane soluble pyruvate, commonly encountered as one of the end products of glycolysis, significantly res- cued MK1775-induced cell death (Online Supplementary Figure S5E), suggesting that the metabolic effect is one of the primary mechanisms underlying MK1775-mediated antileukemic activity.
This metabolic change is presumably due to altered MYC expression resulting from WEE1 inhibition, as enforced MYC expression significantly rescued glycoly- sis defects induced by MK1775 (Online Supplementary Figure S6A). Most likely, MYC acts as an important downstream player mediating the role of WEE1 in regu- lation of glycolysis. Consistent with previous reports that MYC activates a panel of glycolytic gene expression,37 WEE1 inhibition led to downregulation of these genes in T-ALL cells (Figure 3G and Online Supplementary Figure S6B). We also assessed the in vivo effect of MK1775 on glycolysis in a T-ALL patient-
haematologica | 2021; 106(7)
1821
