
Page 53 - 2021_07-Haematologica-web
P. 53
Synergistic targeting of WEE1 and GLS1 in T-ALL
deficiency would synergize with WEE1 inhibition. To test this hypothesis, we treated several T-ALL cells with MK1775 in the presence or absence of glutamine in the culture medium. Glutamine deficiency induced robust cell death in combination with MK1775 treatment in multiple T-ALL cells (Figure 4A), suggesting that inhibition of glut- amine uptake or metabolism exacerbates cell death induced by WEE1 inhibition. Glutaminolysis is a stepwise process by which imported glutamine is converted to glu- tamate (dependent on glutaminase activity) and subse-
quently transformed to a-ketoglutarate, a TCA cycle inter- mediate, for further catabolism and production of NADH.20 GLS1 is the glutaminase converting glutamine to glutamate, which is the first and rate-limiting step in the glutaminolysis pathway. We predicted that co-inhibition of WEE1 and GLS1 would disrupt the integrity of the TCA cycle, leading to metabolic catastrophe and subsequent cell death. Given that the selective GLS1 inhibitor CB-839 has been evaluated in clinical trials for anti-tumor activi- ty,38,39 we therefore determined whether CB-839 elicited a
A
B
C
D
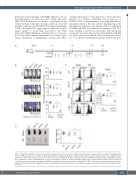
Figure 5. MK1775 and BPTES treatments demonstrate synergistic anti-leukemia efficacy in HPB-acute lymphoblastic leukemia (ALL) xenografts. (A) Graphical illus- tration of HPB-ALL luciferase T-cell ALL xenografts and treatment strategy (see Methods section). Single or dual treatments started at day 6 post engraftment and underwent a “three days on and one day off” schedule for four cycles as illustrated. When control mice became moribund around day 30 post engraftment, all mice were euthanized to assess leukemogenesis in vivo and therapeutic responses. (B) Representative images (left) and quantification (right) of tumor burden as assessed by luciferase luminescence signals in HPB-ALL xenografts (n=5 per group). Combo: combination. (C) GFP+ cells from the spleen and bone marrow were analyzed by flow cytometry (left). (Right) Data from five individual mice. (D) Representative spleen and bone images are shown (top) with spleen weights (bottom). **P<0.01.
haematologica | 2021; 106(7)
1823
