
Page 181 - 2021_07-Haematologica-web
P. 181
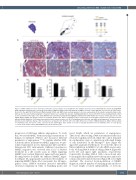
Blocking JAM-A on BM endothelial cells in MM
A
B
Figure 5. JAM-A inhibition reduces myeloma proliferation and vasculature in an intratibial in vivo multiple myeloma model. NOD/SCID mice (n=20) bearing RPMI- 8226 intratibial xenografts were repeatedly treated with a JAM-A blocking monoclonal antibody (a-JAM-A) or isotope control IgG (ISO) for 3 weeks. (A) Upper panel. From left to the right. Ki67/CD138 and JAM-A staining: CD138 and JAM-A (red) reactivity appears to be more represented on the smaller neoplastic plasma cells, whereas the more pleomorphic/anaplastic component shows less reactivity; the opposite staining distribution is observed for Ki67 nuclear staining (brown), which is more prominent in the larger cells. CD31/JAM-A double and CD31 staining (brown) highlight endothelia-lined thin-walled microvessels; lumina appear to be only slightly dilated. JAM-A (red) stains a fraction of neoplastic plasma cells, with a cytoplasmic pattern. Lower panel. Decreased Ki67 expression in specimens treated with anti-JAM-A. Within the CD31-stained non-involved bone marrow lacunae (see CD31+ megakaryocytes) from the anti-JAM-A treated group the vessels are more distended, and endothelia display a thin, inconspicuous cytoplasmic rim. (B) From left to the right, differences in terms of MM proliferation, JAM-A, CD31 positivity on endothelial cells and vessel counts, assessed by two pathologists. Data shown are mean ± standard deviation from ten individual mice for each group. ****P<0.0001 versus controls, Mann-Whitney test. Scale bar=100 mm.
progression of MM may enhance angiogenesis. To study this, we treated MMEC with increasing concentrations of human recombinant sJAM-A and measured different parameters of angiogenesis.17,18 To examine whether JAM- A directly affects spontaneous MMEC migration, we per- formed experiments in two-dimensional (2D) and three- dimensional (3D) environments. Enhanced spontaneous MMEC migration was observed after 12 h of sJAM-A treatment in a 2D scratch assay in which migrating MMEC were counted (Figure 4A, upper and lower panels). Blocking JAM-A abolished the enhanced MMEC migra- tion (Figure 4A, upper panel) and reduced the numbers of migrating MMEC (Figure 4A, lower panel). In a 2D angio- genesis assay, sJAM-A treatment increased endothelial structural complexity in terms of branching points and
vessel length, which are parameters of angiogenesis. Three hours after seeding, sJAM-A treatment resulted in a structured capillary network, while the control remained in a rudimentary stage of organization with small clumps of cells distributed on the MatrigelTM layer (Figure 4B, upper left quadrant). Furthermore, we tested the effect of JAM-A inhibition in MMEC by both siRNA and an anti- body blocking JAM-A without adding sJAM-A (Figure 4B, lower left and upper right quadrants, respectively). Consistently, blocking JAM-A with a monoclonal anti- body impaired the capillary network formation and result- ed in poorly skeletonized structures (Figure 4B, lower right quadrant). The observed down-modulation of MMEC migration, reduced number of branching points and short- er vessel length occurred independently of cytotoxic
haematologica | 2021; 106(7)
1951
