
Page 180 - 2021_07-Haematologica-web
P. 180
A.G. Solimando et al.
C
D
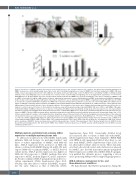
Figure 4. Pivotal role of JAM-A in multiple myeloma-associated angiogenesis in two- and three-dimensional conditions. (A) Upper panel. Confluent monolayers of MMEC underwent a scratch wound-healing assay. Three hours after scratching photographs were taken of MMEC that had been maintained in MMEC CM alone (CTRL) or previously supplemented for 12 h with sJAM-A at 100 ng/mL and treated with isotype control (+sJAM-A +ISO) or anti-JAM-A (+sJAM-A +a-JAM-A) blocking antibody. Lower panel: Migrating cells in each wound were counted. Counts of proliferating and migrating cells of six independent experiments. ****P<0.0001, Mann-Whitney test. (B) Photographs at 3 hours of newly-formed capillary networks after MMEC were seeded on a MatrigelTM layer. Direct comparison of MMEC in CM vs. MMEC treated with 100 ng/mL sJAM-A (upper left panel). Independent experiment to assess JAM-A inhibition in MMEC treated with an anti-JAM-A blocking anti- body or isotype control antibody (upper right panel). Independent experiment to assess JAM-A knock-down in MMEC comparing treatment with JAM-A specific siRNA vs. non-specific scrambled siRNA without addition of sJAM-A (lower left panel). Independent experiment to assess the effect of blocking JAM-A after addition of 100 ng/mL of sJAM-A by comparing capillary formation after MMEC treatment with sJAM-A and anti-JAM-A blocking antibody vs. sJAM-A and isotype control antibody (lower right quadrant). Representative pictures of three biological replicates. Skeletonization of the meshes were analyzed and branching points measured. Data are nor- malized to control. Scale bar=100 μm. (C) Chorioallantoic membrane assay with the gelatin sponge loaded with MMEC CM alone (CTRL) or with MMEC CM supple- mented with sJAM-A (+sJAM-A), in the presence or absence of 0.5 mg/mL anti-JAM-A monoclonal antibody. On day 12, pictures were taken in ovo. One representative experiment is shown at 50X magnification. Newly formed vessels were counted. Mann-Whitney test. (D) An array of 55 human angiogenesis-related proteins was per- formed on MMEC CM after sJAM-A treatment without and with blocking with the anti-JAM-A monoclonal antibody. Array spots were analyzed with ImageJ Lab v. 1.51 software and normalized to positive control signal intensities. Graph bars represent the pixel density of the detected angiogenesis-related cytokines in two independ- ent experiments. Values are expressed as mean ± standard deviation of ten independent experiments. Mann-Whitney test. *P<0.05; ****P<0.0001, versus SFM as control. See Online Supplementary Figure S3 and the main text for more details. MMEC: bone marrow primary multiple myeloma endothelial cells; a-JAM-A: mon- oclonal antibody against JAM-A; sJAM-A: soluble JAM-A; CM: conditioned medium; CTRL: control; SFM: serum-free medium; n.s.: not significant. CAM: chick chorioal- lantoic membrane. ADAMTS1: human metalloproteinase with thrombospondin type 1 motifs; PLG: plasminogen; FGF-2: fibroblast growth factor-2; IGFBP1: insulin- like growth factor binding protein 1; IL8: interleukin-8; TIMP1: tissue inhibitor matrix metalloprotease 1; VEGFA: vascular endothelial growth factor A; VEGFC: vascular endothelial growth factor C.
Multiple myeloma endothelial cells enhance JAM-A expression on multiple myeloma plasma cells
To address how interactions with MMEC functionally influence MM-cell biology, we performed indirect and direct co-culture experiments of MMEC with MM-cell lines. JAM-A expression levels increased on MM-cells when co-cultured with MMEC (Figure 3A and B). We next exposed MM-cells to primary MMEC- or MGEC-derived culture media. JAM-A protein expression was higher on MM-cells after exposure to MMEC medium than after exposure to MGEC medium (Figure 3C and D, respective- ly). Results confirmed JAM-A upregulation upon direct co- culture experiments (Online Supplementary Figure S2A). Notably, only after direct co-culture did MMEC recapitu- late the same behavior as that of MM-cells (Online
Supplementary Figure S2B). Consistently, sJAM-A levels also increased after co-culture of MM-cells with MMEC (Online Supplementary Figure S2C). Similarly to RPMI-8226 cells, OPM-2 cells upregulated JAM-A after direct co-cul- ture with MMEC (Online Supplementary Figure S2D), but not after indirect culture (data not shown). These data indi- cate that both cell-cell contact and soluble factors released by MMEC into the BM microenvironment upregulated JAM-A expression on MM-cells. MMEC JAM-A upregula- tion parallels this dynamic process, suggesting a vicious cycle, promoting MM growth by supporting angiogenesis.
JAM-A enhances angiogenesis in two- and three-dimensional conditions
We hypothesized that JAM-A upregulation during the
1950
haematologica | 2021; 106(7)
