
Page 183 - 2021_07-Haematologica-web
P. 183
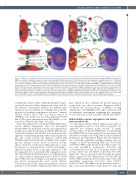
Blocking JAM-A on BM endothelial cells in MM
AB
CD CD
Figure 7. JAM-A boosts multiple myeloma-related angiogenesis in the bone marrow microenvironment. (A) Molecular interactions between MM plasma cells and MMEC: cell-adhesion mediated changes via trans-homo/heterophilic JAM-A interactions. (B) FGF-2 mediates the pro-angiogenic and proliferative roles of JAM-A and the release of monomeric JAM-A from the ternary complex through an unknown mechanism. We speculate that once monomeric JAM-A is available at a membrane level, it forms homodimers that mediate downstream signaling and is also susceptible for cleavage and shedding via ADAM17. (C) JAM-A-mediated cytoskeleton rearrangement via TJP1 downregulation and cell function modification. Depending on myeloma cell-mediated interactions, the endothelial cells can lose their tight junction and thus vascular permeability can increase. (D) An interaction between PLG and ENO1 triggers angiogenesis and microenvironmental modifications via JAM-A. Caveolin1 modulates the transport of cytosolic ENO-1 to the cell surface. α-JAM-A: monoclonal antibody against JAM-A. BM: bone marrow; MMEC: bone mar- row primary multiple myeloma endothelial cells; FGF-2: fibroblast growth factor-2; ADAM17: ADAM metallopeptidase domain 17; TJP1: tight junction protein-1; PLG: plasminogen; ENO1: enolase 1; LFA-1: lymphocyte function-associated antigen 1; MAPK: mitogen-activated protein kinase; avβ3: integrin alpha V beta 3; CD9: CD9 molecule; VEGFA: vascular endothelial growth factor A; ADAMTS1: human metalloproteinase with thrombospondin type 1 motifs. AURKA: aurora kinase A.
on MM-cells, whereas TJP1, CASK and ADAM17 expres- sion levels decreased (Online Supplementary Figure S3G-K). We therefore investigated whether the induced gene expression was non-random, by studying other molecules involved in neoplastic angiogenesis processes,12 namely VEGFA, VEGFC, HGF, FGF16 and Aurora kinase A (AURKA);20 also in this case we found significant VEGFA and AURKA gene upregulation after MM-MMEC co-cul- ture (Online Supplementary Figure S3F and L).
These data support the concept that MM-MMEC inter- actions enhance angiogenesis. Thus, we investigated whether MM cells participate actively in the angiogenesis program in a reciprocal interaction with the BM microen- vironment in patients and whether a pro-angiogenic gene signature could identify patients with worse progression- free and overall survival. We therefore studied 646 NDMM patients enrolled in the CoMMpass trial, compar- ing two different cohorts, based on survival outcome (alive vs. dead for overall survival and progressed vs. ongo- ing disease for progression-free survival) performing a supervised analysis based on the gene expression of the pro-angiogenic factors contained in the angiogenesis array and other well-known JAM-A interactors. Strikingly, these two cohorts differed significantly: JAM-A, ENO-1, VEGFA and AURKA were all overexpressed in patients experienc- ing shorter progression-free and overall survival. Conversely, reduced TJP1 expression in patients correlated with poor survival (Online Supplementary Table S3). These
gene expression data confirmed the protein expression results from our cohort of patients. Exogenous JAM-A modulated the secretory profile of MMEC, favoring angiogenesis, and highlighted the tight connection with an angiogenic environment, comprising key angiogenic factors, such as PLG, FGF-2, IGFBP1, VEGFA and VEGFC.
JAM-A inhibition impairs angiogenesis and inhibits tumor growth in vivo
To investigate whether JAM-A inhibition may affect in vivo angiogenesis and in turn MM-cell growth, we employed two different mouse models. To mimic advanced MM21 we injected RPMI-8226 cells intratibially into NOD-SCID mice and analyzed bone specimens after anti-JAM-A treatment.2 Blocking JAM-A reduced MM-cell proliferation and angiogenesis (Figure 5A). The difference was statistically significant regarding numbers and per- centages of Ki-67high proliferating MM-cells (79.87±1.242 and 35.38±0.3455 in the groups treated with isotype con- trol and anti-JAM-A, respectively; P<0.0001) and vessels/mm2 field (9.3 and 7.1 in the groups treated with isotype control and anti-JAM-A, respectively P<0.0001) (Figure 5B). The group treated with the antibody against JAM-A expressed lower JAM-A levels (79.78±1.443 and 36.98±0.466 in the groups treated with isotype control and anti-JAM-A, respectively; P<0.0001), lower CD31% (5.58±1.34 and 3.48±0.646 in the groups treated with iso- type control and anti-JAM-A, respectively; P<0.0001) and
haematologica | 2021; 106(7)
1953
