
Page 177 - 2021_07-Haematologica-web
P. 177
Blocking JAM-A on BM endothelial cells in MM
AB
C
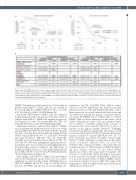
Figure 2. Elevated JAM-A expression on bone marrow primary endothelial cells predicts poor prognosis in relapsed refractory multiple myeloma. Kaplan-Meier esti- mator of OS (A) and PFS (B), by level of surface MMEC JAM-A expression. (C) Cox model set on OS and PFS analyses. The median follow-up was 53 months (4-262 months) for OS and 23 months (1-119 months) for PFS. *Cox models adjusted for sex and age. **Cox stratified hazards regression by chronic kidney disease. OS: overall survival; PFS: progression-free survival; MMEC: bone marrow primary multiple myeloma endothelial cells. Pts: patients. NR: not reached. R-ISS: Revised International Staging System; Hb: hemoglobin.
semination (χ2=7.04, P=0.008). Thus, JAM-A surface
expression on BM endothelial cells derived from MM
patients exerted a strong and independent effect, with a
linear trajectory, on overall survival in both cohorts and
an additive poor prognostic impact on progression-free
survival in the RRMM cohort. Additionally, we divided
MMEC JAM-A surface expression of the entire cohort
(Online Supplementary Figure S1D) into quartiles (JAM-
AQ1 to JAM-AQ4) and then compared the outcomes of
patients in the lowest quartile (JAM-AQ1) to those of
patients in the highest quartile (JAM-AQ4). Strikingly,
overall survival differed significantly: the median overall
survival was 88 months in JAM-AQ4 patients and was not
MMEC. The median overall survival was 130 months in patients with JAM-Ahigh MMEC and was not reached in those with JAM-Alow MMEC (HR=2.96, 95% CI: 1.36– 6.37, P<0.006; χ2 =8.52; P=0.0035) (Figure 2A).
LR
In patients with JAM-Alow MMEC cells, the estimated
median progression-free survival was 27 months, while, in subjects with JAM-Ahigh MMEC the median progression- free survival was only 18.3 months (HR=1.41, 95% CI: 1.05-1.88; P=0.019; χ2 =5.78; P=0.0162) (Figure 2B).
LR
Multivariate analyses confirmed that JAM-Ahigh MMEC
was an independent significant risk factor for low overall survival (HR=2.39, 95% CI: 1.09-5.28; P=0.030) in much the same way that Revised International Staging System (R-ISS) stage II (HR=5.34, 95% CI: 1.24-22.97; P=0.024) and stage III disease (HR=0.57, 95% CI: 1.25-34.54; P=0.026) and chronic kidney disease (HR=2.12, 95% CI: 1.00-4.52; P=0.049) were independent significant risk fac- tors (Figure 2C). A Cox stratified model implemented for progression-free survival confirmed only high levels of membrane MMEC JAM-A as a statistically significant risk factor (HR=1.35, 95% CI: 1.00–1.81; P=0.044) stratified by chronic kidney disease (Figure 2C).
Interestingly, only JAM-Ahigh MMEC remained signifi- cant in the multivariate model. Moreover, we found a significant association in the setting of RRMM between JAM-Ahigh MMEC and R-ISS stage II and III disease (χ2=17.4, P<0.0001) and the risk of extramedullary dis-
reached in JAM-AQ1 patients (HR=8.24, 95% CI: 3.2-
20.9, P<0.0001; χ2 =28.15; P<0.0001). Interestingly, LR
JAM-AQ4 MMEC maintained significance in the multi- variate Cox-model (HR=6.36, 95% CI: 2.30-17.63; P<0.001). This comparison further corroborated the role of JAM-A-positive vs. JAM-A-negative MMEC in predict- ing poor clinical outcome in our cohort (Online Supplementary Figure S1E, upper and lower panels). The absence of a statistically significant impact on progres- sion-free survival of patients with NDMM is likely due to a more pronounced effect of JAM-A MMEC expres- sion in more advanced stages of MM. This suggests the importance of JAM-A within the BM microenvironment during disease progression.
haematologica | 2021; 106(7)
1947
