
Page 175 - 2021_07-Haematologica-web
P. 175
Blocking JAM-A on BM endothelial cells in MM
Statistical analysis
A descriptive analysis was carried out using the median and interquartile range for the quantitative variables and percentage values for the qualitative ones. The normality of the distribution of data was tested using the Shapiro-Wilk test. The levels of JAM- A expression on membrane MMEC, determined by mean fluores- cence intensity (MFI) in fluorescence activated cell sorting (FACS), were dichotomized into two classes, JAM-Ahigh and JAM-Alow, choosing the median as the class boundary (Online Supplementary Methods). Moreover, for further confirmation, survival was ana- lyzed using a model based on quartile ranges (Online Supplementary Methods).
Results
Elevated JAM-A expression on bone marrow primary multiple myeloma endothelial cells correlates with poor prognosis in both newly diagnosed and relapsed/refractory multiple myeloma
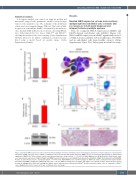
First, we compared JAM-A expression in MMEC and MGUS-derived endothelial cells (MGEC) (Figure 1A). JAM-A mRNA expression in MMEC significantly exceed- ed JAM-A levels in MGEC (1.8-fold difference, P<0.0001) and in endothelial cells from healthy subjects (Online Supplementary Figure S1A). Subsequent western blot analy-
AC
B
D
Figure 1. Elevated JAM-A expression on bone marrow primary multiple myeloma endothelial cells in newly diagnosed patients correlates with poor overall survival.
(A) Relative mRNA expression level of JAM-A of endothelial cells from patients with multiple myeloma (MMEC) (n=73) or monoclonal gammopathy of undetermined significance (MGEC) (n=73) by real-time reverse transcriptase polymerase chain reaction. ****P<0.0001, Mann-Whitney test. (B) Western blot densitometric analy- sis of basal protein expression of JAM-A of MGEC and MMEC lysates normalized to β-actin (MGEC from 24 patients with MGUS; MMEC from 24 patients with NDMM). Results are presented as mean ± standard deviation, ****P<0.0001, Mann-Whitney test. (C) FACS analysis of JAM-A cell surface expression from representative patient-derived MMEC, identified as CD45/138/38neg/31pos cells. (D) JAM-A overexpression colocalizes with higher vessel density on bone marrow biopsies. Vessel density (as highlighted by CD34 [red] staining) was higher in bone marrow spaces infiltrated by JAM-Ahigh (brown) neoplastic plasma cells, as compared to JAM-Alow cases. Magnification x 200. Scale bar=50 mm. (continued on the next page)
haematologica | 2021; 106(7)
1945
