
Page 176 - 2021_07-Haematologica-web
P. 176
A.G. Solimando et al.
E
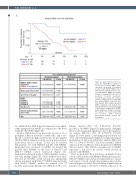
Figure 1. (continued from the previous page). (E) Kaplan-Meier estimator of OS, by level of surface MMEC JAM-A expression. The median OS estimated in subjects with JAM-Alow MMEC cells at FACS was not reached whereas in sub- jects with JAM-Ahigh MMEC, the median OS was 78 months (HR=9.14, 95% CI: 2.8-29.76, P<0.0001; χ2LR=20.11; P<0.0001, upper panel). Uni- and mul- tivariate analysis (lower panel). BM: bone marrow; MMEC: endothelial cells from patients with multiple myeloma; MGEC: endothelial cells derived from patients with monoclonal gammopathy of undetermined significance; NDMM: newly diagnosed multiple myeloma; Pts: patients. OS: overall survival; NR:
not reached. R-ISS: International Staging System; Hb: hemoglobin.
Revised
sis confirmed that JAM-A protein expression was signifi- cantly upregulated in MMEC in comparison to the levels in MGEC (P<0.0001) (Figure 1B).
Because JAM-A had been previously proven to be a prominent adhesion molecule on MM cells,2 and is also known to form homophilic interactions,1 we investigated whether JAM-A expression in the vascular microenviron- ment affects disease outcome. To this end, we enrolled 312 patients, 111 with NDMM and 201 with RRMM. Employing flow cytometry on MMEC we divided the patients with NDMM on the basis of JAM-Ahigh and JAM-Alow MMEC surface expression (Figure 1C). Immunohistochemical analyses of BM trephines corrobo- rated the findings (Figure 1D, Online Supplementary Figure S1B and C). Notably, overall survival was significantly shorter in patients with JAM-Ahigh MMEC than in patients with JAM-Alow MMEC: median not reached versus 78 months, respectively (hazards ratio [HR]=9.14, 95% con-
fidence interval [95% CI]: 2.80-29.76;, P<0.001; χ2 =20.11; P<0.0001) (Figure 1E upper panel). Strikingly,
LR
these results maintained significance also in the multivari-
ate analysis (HR=9.11, 95% CI: 2.79-29.76; P<0.001) (Figure 1E lower panel). Concerning progression-free sur- vival, only renal impairment displayed a significant impact in univariate as well as in multivariate analyses (HR=1.64, 95% CI: 1.09-2.47, P=0.017). The level of MMEC JAM-A expression did not influence risk of progression in NDMM (data not shown). Thus, JAM-A overexpression on MMEC represents a risk factor for shorter overall survival in patients with NDMM.
Next, we performed flow cytometry on samples from a cohort of 201 patients with RRMM. Within these patients, JAM-Ahigh MMEC represented an independent poor prog- nostic factor for both overall survival and progression-free survival (Figure 2A and B). Survival differed significantly in patients according to the level of JAM-A expression on
1946
haematologica | 2021; 106(7)
